Category: LinkedIn Articles

  • Credit: ©JJ GOUIN – STOCK.ADOBE.COM

    Credit: ©JJ GOUIN – STOCK.ADOBE.COM

    ANDR'E MAGRINI – AMV | Chicago — Agribusiness Strategy & Data

    Brazil is no longer just the world’s largest soybean producer. It is the price-setter, volume-setter, and geopolitical swing supplier of the most important protein and vegetable-oil complex on the planet.

    Soybeans now sit at the intersection of three global systems:

    Food (animal protein and human nutrition)
    Energy (biodiesel and renewable diesel)
    Geopolitics (China’s feed security and trade leverage)

    And Brazil controls more of that system than any country in history ever has.

    Yet beneath the record harvests and export headlines sits a structural weakness so large that it is quietly transferring tens of billions of dollars per year away from Brazilian producers and into the hands of global traders, freight carriers, and foreign logistics owners.

    Brazil has become a superpower in production — but remains a developing economy in logistics.

    That mismatch now defines the entire soybean market.

    From Tropical Experiment to Global Price Engine

    Fifty years ago, Brazil was a marginal soybean player. The Cerrado was considered agronomically unusable. Soils were acidic, aluminum-toxic, and biologically dead.

    What followed was one of the greatest agricultural transformations in history:

    EMBRAPA soil science
    Tropicalized soybean genetics
    Lime, phosphorus and no-till
    Large-scale mechanization
    Double-cropping systems

    That unlocked more than 200 million hectares of new agricultural frontier.

    Brazil’s soybean curve is unprecedented:

    AMV – Andre Magrini Ventures – andremagriniventures.com

    No country has ever scaled a single crop this fast, over this much land, with this level of export dependency.

    Brazil didn’t catch the U.S. It structurally surpassed it.

    2025–26: Brazil Is Running at Full Power

    The current cycle confirms Brazil’s dominance.

    49.1 million hectares planted (+3.1% YoY)
    98.5% of area already planted by December
    177 million tonnes expected production
    113 million tonnes projected exports

    China remains the gravitational buyer. Shipments to China are up 16.5% year over year, reinforcing Brazil as Beijing’s primary protein security partner.

    But something more important is happening inside Brazil.

    Brazil has turned soy into energy.

    With the biodiesel blend rising from B14 to B15 (and B16 likely), domestic soybean oil demand is surging:

    12.3 million tonnes of soybean oil produced
    Over 7 million tonnes used for biodiesel
    75% of Brazilian biodiesel is soy-based

    This creates a domestic demand floor that didn’t exist a decade ago. Brazil is now converting soybeans into both export protein and domestic energy.

    This should be a golden age.

    Instead, Brazil is bleeding value.

    The Storage Crisis No One Prices In

    Brazil’s single biggest competitive weakness is not land, labor, or yield.

    It is storage.

    Brazil produces ~177 million tonnes of soy. It can store roughly 110–120 million tonnes.

    That means 30–40% of the crop has nowhere to go.

    The U.S., by contrast, has storage capacity exceeding 150% of production.

    This changes everything.

    When you cannot store grain, you do not have inventory — you have forced sellers.

    That creates:

    Harvest-time price collapses
    Port congestion
    Truck queues thousands of kilometers long
    Emergency outdoor stockpiles
    Moisture and quality losses
    Exploding basis spreads

    Brazil loses billions of dollars per year not because it produces poorly — but because it is forced to sell when the world knows it must.

    This is a structural tax on Brazilian agriculture.

    The Logistics Penalty: Where the Money Really Disappears

    Brazil grows soy cheaper than the U.S. But the U.S. ships soy cheaper than Brazil.

    Why?

    Consider two soybeans:

    Soybean A grows in Mato Grosso, Brazil. It is harvested, loaded onto a truck, and driven 1,000 miles down BR-163 to Santos or Paranaguá. During peak harvest it may wait 10–20 days in line before unloading.

    Soybean B grows in Iowa. It moves 40 – 80 miles to a local elevator, is stored, then loaded onto a barge or railcar and shipped 1,500 km to the Gulf at industrial-scale efficiency.

    Both beans travel similar distances. Only one of them is moved by a modern logistics system.

    That difference is why the U.S. owns the basis and Brazil does not.

    A soybean grown in Mato Grosso travels 1,100–1,500 miles by truck before it ever reaches a port. A soybean grown in Iowa travels less than 200 miles before it hits a barge or rail line that moves it the rest of the way at a fraction of the cost.
    Why This Now Shapes Global Power

    Soybeans are no longer just feed.

    They are:

    Food security
    Energy security
    Trade diplomacy
    Strategic leverage

    China’s livestock sector runs on Brazilian soy. Brazil’s biodiesel system runs on soy oil. Europe’s feed system runs on Brazilian meal.

    Brazil controls the volume — but not the flow. And in commodity power, flow is everything.

    The Coming Reckoning

    Brazil has won the agronomic war.

    The next war is logistics, storage, and capital efficiency.

    Until Brazil:

    Doubles storage capacity
    Expands rail and inland waterways
    Builds inland logistics hubs
    Digitizes grain flow

    It will continue to lose $10–20 billion per year in invisible penalties — even as it breaks export records.

    Brazil has become the world’s soybean farm.

    The next question is whether it becomes the world’s soybean platform.

    And that will determine who really owns the future of global food and energy.

  • The Death of Gut-Feel: 5 Brutal Truths About Your Revenue Engine

    The Death of Gut-Feel: 5 Brutal Truths About Your Revenue Engine

    1. The Efficiency Crisis: Why Strategy Fails at the Front Line

    We are currently enduring an efficiency crisis where the math simply doesn't add up. Most sales organizations are burning capital on enablement programs that fail to translate into field results. The data is sobering: currently, two-thirds of companies feel their enablement efforts fall short, and 45% or fewer reps are actually hitting their targets.

    The relatable struggle for sales leadership is no longer about "more activity"; it’s about visibility. Organizations are flying blind, unable to distinguish a winnable deal from a resource drain. To survive this cycle, AI and data must move from back-office reporting to the strategic front lines. We are witnessing a shift from "gut-feel" management to leadership rooted in hard field evidence.

    See content credentials
    2. The AI Paradox: Why "Simple" Models Outperform Deep Learning

    In the rush to adopt generative and deep learning models, many leaders overlook a technical reality: complexity often degrades accuracy in real-world environments. A comparative analysis of machine learning models for retail forecasting reveals that tree-based ensembles—specifically XGBoost and LightGBM—consistently outperform sophisticated neural networks like Temporal Fusion Transformers (TFT) or N-BEATS.

    Why this happens: Brick-and-mortar (B&M) data is inherently fragmented. Unlike centralized e-commerce giants (like Amazon or Zalando) that benefit from aggregated demand signals, B&M environments deal with "noisy," intermittent demand across thousands of physical locations. Deep learning models are highly sensitive to this "data noise" and often require extensive imputation to bridge gaps in historical visibility. However, localized modeling strategies—which focus on specific product groups rather than category-wide aggregates—using tree-based models offer superior robustness against regime shifts and assortment volatility.

    Why it matters: Complexity is not a proxy for performance. In fragmented environments, localized, tree-based models provide higher computational efficiency and greater accuracy, ensuring your forecast is a fact-based foundation rather than a black-box guess.

    ——————————————————————————–

    3. Reps are Drowning in Tools but Starving for Readiness

    We have reached the tipping point of "tool fatigue." While leadership buys software to solve problems, the sheer volume of disparate systems has become the primary bottleneck to productivity. The statistics are staggering: 46% of sales organizations use 10 or more technologies daily.

    This fragmentation forces reps to jump through multiple hoops to address a single buying signal, creating siloed workflows that erode selling time. To win, organizations must consolidate toward a "single engaging and personalized system of record."

    Why it matters: Consolidation is a competitive advantage, not just a cost-saving measure. By unifying training, content, and intelligence into one platform, you transform your tech stack from a collection of "screens to fill out" into a high-octane engine for sales execution.

    ——————————————————————————–

    4. RevOps is the "Engine," Sales Ops is the "Gear"

    The industry often conflates Sales Ops and Revenue Operations (RevOps), but the distinction is the difference between a functional silo and a unified growth engine. Sales Ops is tactical and department-specific; RevOps is the strategic feedback loop that aligns the entire customer lifecycle.

    This alignment is a proven growth lever: companies with unified RevOps see 19% faster growth and 15% higher profitability. The relationship functions as a continuous loop: RevOps identifies the strategic bottleneck (e.g., lead-to-close friction), Sales Ops implements the tactical fix, and RevOps scales that success across Marketing and Customer Success.

    5. Stop Focusing on Deals; Start Modeling People

    The "original wave" of revenue intelligence made the mistake of building a business deal-by-deal. But deals don't close themselves; people do. To scale, you must move beyond tracking deal health and begin modeling "Winning Behaviors" through Ideal Rep Profiles.

    The most critical metric for modern leaders is the Sales Readiness Index—a benchmark that quantifies the skills, will, and behaviors of your team. This index is more predictive than pipeline volume because it identifies performance gaps before they manifest as missed quotas. When you align your team to these behaviors, winnable deals become the natural output of a ready workforce.

    ——————————————————————————–

    6. 95% Forecast Accuracy is a Process, Not a Guess

    Traditional forecasting is a manual, "gut-feel" exercise that drains hours from your week. Modern revenue intelligence automates this into a fact-based process capable of 95%+ accuracy, saving RevOps teams more than 30 hours of manual work a week.

    This isn't achieved through CRM data entry alone. AI now leverages speech and text analytics to track "non-obvious" signals across every touchpoint:

    Engagement Signals: Meeting invite declines, the ratio of contacts engaged, and the specific titles of those contacts.
    Risk Identification: Automatically flagging deals that are "single-threaded" or missing a champion.
    Self-Correction: Uncovering deal blockers in real-time and immediately suggesting the specific coaching or content needed to unblock the revenue.

    ——————————————————————————–

    Conclusion: The Future of the Revenue Engine

    The winners of the next economic cycle will be the leaders who unify their data into a Single Source of Truth (SSoT). As revenue technologist Jeff Ignacio suggests, an effective SSoT ensures that every department—from Marketing to Success—is "drinking from the same well." When everyone relies on the same definitions and data, discrepancies vanish and execution accelerates.

    As you audit your current GTM strategy, ask yourself: "Is this tool helping my reps sell, or is it just another screen they have to fill out?"

    The transition from gut-feel leadership to field-evidence leadership is the only path to predictable growth. By focusing on rep readiness, consolidating your stack, and embracing robust (not just complex) AI, you transform your revenue engine into a precision instrument.

  • Autonomous Preemptive Maintenance (APM) and the Zero-Lag Enterprise

    Autonomous Preemptive Maintenance (APM) and the Zero-Lag Enterprise

    Stop Predicting, Start Prescribing: The Next Evolution of Maintenance

    We’ve all celebrated the shift to Predictive Maintenance (PdM). Using sensors and AI, we can now foresee a machine failure weeks or months in advance. Great, right?

    Not entirely.

    The industry is facing a critical bottleneck: PdM only gives you a warning. The most critical and expensive part of the process—deciding who fixes it, when to shut down production, where to get the part, and how to budget for it—still relies on slow, manual, and disconnected human teams.

    The future demands a closed-loop system. We need to move beyond simple prediction and into a methodology that not only anticipates the future but automatically executes the optimal business response.

    This is the principle behind what I named: – Autonomous Preemptive Maintenance (APM).

    What is Autonomous Preemptive Maintenance (APM)?

    APM is a novel, AI-driven framework that treats maintenance not as an isolated engineering task, but as an integrated business optimization process. It’s the "PreCog" system of asset management, where AI doesn't just predict the future; it proactively shapes it across three critical business pillars:

    1. The Autonomous Control Correction (ACC): The Self-Healing Asset

    This is the truly preemptive core. When APM’s AI detects a degradation signature, its first action is not to create a work order. Instead, it interfaces directly with the machine’s operational software (OT Layer) to make tiny, real-time adjustments—a slight speed reduction, a temperature correction, or a flow adjustment.

    The Impact: This action often mitigates the fault’s progression entirely, extending the asset’s life and delaying or even eliminating the need for a costly, disruptive shutdown. The machine heals itself, guided by the AI.

    2. Autonomous Resource Orchestration (ARO): Zero-Lag Planning

    If the ACC cannot fully resolve the issue, APM moves to strategic execution. The ARO module takes over the human function of planning.

    It calculates the optimal, least disruptive maintenance window to minimize impact on the production schedule (OEE Maximization).
    It automatically schedules the work in the CMMS and assigns the best-qualified technicians based on their current availability and skill set.
    The final planned shutdown notification is then automatically sent to the Production Manager.

    The Impact: No more urgent email chains, no more scheduling conflicts. The intervention is planned with maximum efficiency and minimum interruption.

    3. Autonomous Supply Chain & Financial Forecasting (ASCF): Eliminating Budget Shocks

    This is where APM delivers strategic financial value.

    When the maintenance date and required parts are known, the ASCF module takes immediate action:

    It checks real-time inventory and triggers an automatic purchase order if stock is low, based on optimized quantity calculations (EOQ).
    It generates a detailed disbursement forecast for the Finance team, converting a potential emergency cost into a predictable, budgeted line item.

    The Impact: Eliminates costly emergency procurement fees, prevents capital from being tied up in excessive spare parts inventory, and turns the maintenance budget into a predictable, strategic flow.

    The Path to Full Autonomy: From Cognitive Brain to Physical Execution

    While the core APM framework handles the cognitive and logistical complexity, achieving a truly full AI Autonomous solution requires integrating the final layers of physical execution and strategic oversight.

    4. Physical Autonomy

    For APM to close the loop entirely, the system must automate the physical work. This involves Robotics Integration and Deployment, where the APM system can instruct a collaborative robot (cobot) or an Unmanned Aerial Vehicle (UAV) to perform simple tasks like tightening a bolt, applying lubricant, or replacing small modular components. Furthermore, Autonomous Sensor Calibration is vital, allowing the system to remotely adjust or replace its own monitoring devices, guaranteeing the integrity of its data inputs without human touch.

    5. Strategic Optimization and Continuous Improvement

    A truly strategic tool must not only fix the current problem but prevent the next one by improving the fundamental processes.

    Autonomous Root Cause Analysis and Process Feedback: After a fix, a Process & Design Improvement (PDI) Agent analyzes the event's data. If it detects a recurring fault pattern, the PDI agent autonomously flags the issue as a systemic "Design Flaw" or "Operational Stress Point" and sends a formal recommendation to the Engineering Department (e.g., "Recommend redesign of component X"). This elevates maintenance to a strategic contributor to product design.
    Autonomous Knowledge Management: A Self-Learning Documentation System (SLDS) uses video and audio capture of human repairs to instantly generate and optimize standardized digital work instructions. This instantly scales the expertise of your best technician across the entire team and drastically reduces time spent on documentation.
    External Vendor Optimization: An External Service Optimization (ESO) Module autonomously generates RFPs for specialized work, cross-referencing vendor bids against historical performance and fair market rates. This ensures the organization gets optimal value from every specialized external service, converting a complicated procurement process into an autonomous strategic negotiation.

    APM: The Road to the Zero-Downtime Enterprise

    APM represents the ultimate convergence of Maintenance 4.0, combining advanced prognostics with genuine operational and financial autonomy. It replaces human-dependent workflows with a self-aware, self-healing, and self-managing industrial ecosystem.

    This framework is not just about extending asset lifespan; it’s about optimizing the Total Cost of Ownership (TCO) and ensuring that every dollar spent on maintenance is done so predictably, strategically, and at the optimal moment.

    The era of waiting for a human to act on a prediction is over. The future is autonomous.

    #AutonomousMaintenance #PrescriptiveMaintenance #Industry40 #AI #AssetManagement #MaintenanceTech

  • How to Measure the “Hard” ROI of AI Transformation: A CRO’s Simple, Data-Driven Playbook

    How to Measure the “Hard” ROI of AI Transformation: A CRO’s Simple, Data-Driven Playbook

    By André Magrini, Chief Revenue Officer, OGI Systems (An Objective Company)

    In the world of Digital Transformation, we're past the conversation of if AI can drive value. The real mandate for executive leadership—and especially for a Chief Revenue Officer—is proving the "hard" Return on Investment (ROI) of AI initiatives.

    Many AI projects stall or fail to secure continued funding because the benefits remain anecdotal. To move AI from a pilot program to a core component of your revenue engine, you must translate performance improvements directly into verifiable dollars.

    At OGI, our approach as your "digital construction and renovation team" is always to start with a clear architectural blueprint. When implementing AI, this means focusing on precision measurement.

    Based on best practices from leading technology firms, here is the simple, four-step playbook we use to measure the hard ROI of any AI deployment.

    The Data-Driven Playbook for Measuring AI ROI

    Measuring hard ROI is a relatively simple process—but it demands methodical discipline and a laser focus on key business metrics.

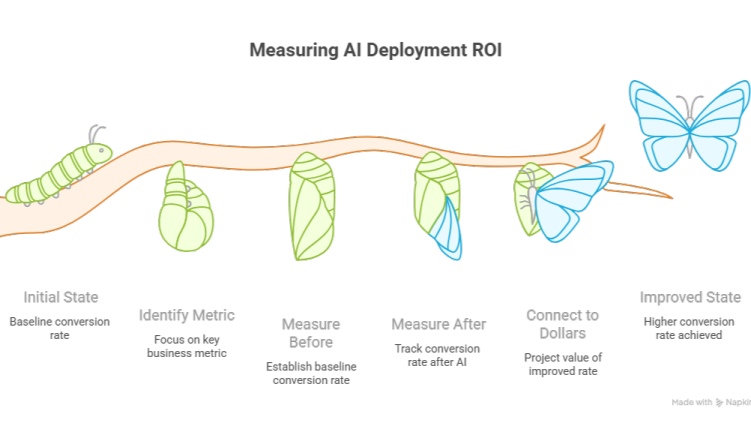
    1. Pick a Specific Deployment, Not "AI" Broadly.

    The scope must be narrow and actionable. Instead of trying to calculate the holistic ROI of your "AI strategy," isolate one single workflow that your team is planning to augment.

    Example in Practice (The Blueprint): Your goal is not "improving sales intelligence." It is "improving the conversion rate (CVR) from BDR outreach to a booked discovery call" using a specific AI tool, such as a custom GPT to refine prospect targeting.

    2. Identify the Business Metric That Matters.

    The metric you choose must directly impact a measurable revenue or margin driver. If the metric is too far upstream (e.g., "AI model uptime"), its connection to the bottom line becomes speculative.

    Actionable Metric (The Foundation): The critical metric here is the Conversion Rate from Outreach to Discovery Call. This single metric drives the opportunity rate and, ultimately, revenue. By impacting this metric, you are influencing a solid, revenue-driving business outcome.

    3. Measure the Before and After State.

    Establishing a clear baseline is the cornerstone of proving incremental value. Every "renovation" must start with a diagnosis of the "house" as it stands.

    The Baseline (The "Before"): Before deploying the AI tool, determine the typical conversion rate for BDR outreach over the last quarter. This establishes your baseline performance.
    The Outcome (The "After"): After a predetermined test period (e.g., three months), rigorously measure the new conversion rate achieved only by the BDRs using the AI augmentation.

    4. Connect the Improvement to Dollars.

    The final step is translating the percentage increase in your core metric into quantifiable financial value.

    The Calculation (The ROI Link): The discovery call itself won't tell you anything about the overall outcome—you need to assign a value to it.
    If your AI-driven improvement increases the number of qualified discovery calls by X and you know the conversion value of each call is Y, your hard ROI is simply X multiplied by Y, minus the cost of the AI tool.

    Why This Discipline Matters

    As a CRO, my focus is on predictable, scalable revenue. This methodical approach to measuring AI ROI achieves two critical goals:

    De-risks AI Investment: By starting small and proving the ROI of a specific deployment, you can secure budget for larger, more strategic AI initiatives. You demonstrate financial prudence before scaling the "renovation."
    Builds Internal Confidence: When your sales and finance teams see an immediate, tangible return—a clear, data-driven link between the technology and revenue—it builds unwavering confidence in the long-term digital strategy.

    At OGI, we believe that AI transformation should never be a leap of faith. It should be a planned, measured process that guarantees a return. Start small, measure everything, and watch your AI investments evolve from overhead to undeniable revenue drivers.

    #AI #CRO #SalesStrategy #RevenueOperations #DigitalTransformation #OGISystems

  • Why the Customer Journey is the Engine of Revenue Growth

    Why the Customer Journey is the Engine of Revenue Growth

    For any medium or large company embarking on a digital journey, the Customer Journey is the single most critical asset to understand and optimize. At OGI, we see it as the true "engine of revenue growth," transforming complexity into measurable results. It is the roadmap that dictates success in sales, marketing, and long-term customer value.

    The Strategic Imperative of the Customer Journey

    Understanding the customer journey is crucial because it helps you to:

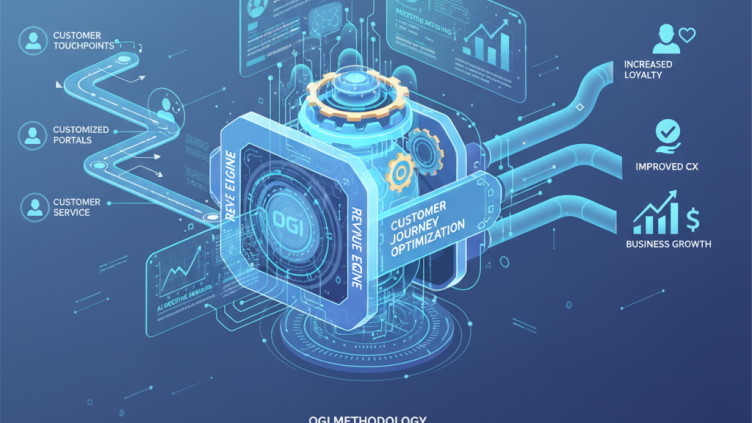
    Identify Customer Touchpoints: Analyzing every point of interaction between the customer and your brand. These touchpoints—from your Digital Experiences & Customized Portals to customer service—are opportunities to engage, provide value, and build a lasting relationship.
    Improve Customer Experience (CX): By pinpointing areas of friction or pain points in the customer's experience, you can execute targeted repairs or a complete overhaul that leads to higher satisfaction and loyalty. This is where OGI’s diagnostic approach to "identifying and fixing what's not working in their processes and systems" begins.
    Increase Customer Loyalty: A consistently positive customer journey leads to higher loyalty and advocacy. Loyal customers are more likely to make repeat purchases, recommend your brand, and boost your Customer Lifetime Value (LTV).
    Inform Business Strategy: Insights from the journey directly inform product development, marketing, and Sales Strategies. By knowing what customers want and need, you can align your offerings, leading to increased sales and business growth. This is the core of our Strategic Consulting service.

    How OGI Enhances the Customer Journey for Revenue Acceleration

    Our unique methodology, acting as your "digital construction and renovation team," ensures that we don't just map the journey; we embed data and AI to continuously optimize it.

    1. The Diagnostic: Map the Customer Journey and Find the Friction

    We start by identifying all customer touchpoints, leveraging a Discovery phase to create a visual map. Our initial step is often a

    Digital Product Health Check , which uses a consulting mindset to quickly identify bottlenecks and critical issues that are blocking task completion and causing customer pain points. We pinpoint where processes are inefficient so we can "tidy up" your systems first.

    2. The AI-Driven Overhaul: Personalization at Scale

    To move beyond generic experiences, we leverage AI & Machine Learning to achieve hyper-personalization at scale:

    Advanced Customer Segmentation: We use AI-powered analytics (like those available in our partner platform Liferay DXP ) to go beyond demographics. We enable dynamic customer segmentation based on real-time behavior, preferences, and intent. This enables the delivery of tailored offers, messages, and content in real-time.
    Predictive Modeling: Our Data & AI services, specifically Predictive and Prescriptive Analysis , enable you to anticipate customer behavior and preferences. This helps you proactively optimize touchpoints and guide customers effectively, turning data into real business value.

    3. The Execution: Low-Friction, High-Quality Delivery

    Frictionless Transactions and Digital Experiences: We use Liferay DXP to build modern digital portals (Customer Portals, Self-Service Portals, Intranets) that deliver unified, seamless, and optimized omnichannel experiences. Our focus is on removing friction from the customer's path, enhancing key functions like quoting and self-service.
    Agile and Automated Operations: We integrate Hyperautomation (including No-Code tools like WEM ) and robust DevSecOps practices. This allows for swift delivery of new features and ensures that workflows and business process automation are continuous and efficient.

    By focusing on the customer journey with this level of detail—from an initial diagnosis to full AI-driven transformation—OGI ensures execution is not a burden but a strategic advantage that unlocks scalable performance.

    Hey, send me a message if you want to learn more or discuss it!

  • Sales Disruption: Why It’s Crucial for Business Growth Today

    Sales Disruption: Why It’s Crucial for Business Growth Today

    Looking back at my years in sales and business development, one thing has become crystal clear: in today’s hyper-competitive market, companies unwilling to innovate and adopt new approaches to selling their products or services are bound to fall behind. This is precisely where sales disruption makes all the difference. Unlike traditional selling, which often focuses on conventional strategies like mass marketing and aggressive sales forces, sales disruption seeks to embrace new technologies and creative marketing approaches that stand out from the competition.

    The benefits of sales disruption are numerous:

    Customer-Centric Focus: One of the key advantages of sales disruption is its ability to allow companies to truly focus on the needs and wants of customers, creating products or services that genuinely meet those needs. When customers feel valued and realize that a company is genuinely concerned about their needs, they tend to become more loyal and engaged with the brand.

    Market Expansion & Revenue Growth: Sales disruption empowers companies to reach new markets and expand their customer base. By adopting innovative technologies and business models, businesses can unlock new sales opportunities and connect with new audiences, leading to a significant increase in revenue and profits.

    Adaptability to Market Changes: This disruptive approach also helps companies adapt quickly to shifts in the marketplace, such as changes in consumer preferences, technological advancements, or competitive pressures. Companies that embrace sales disruption are consistently one step ahead, signaling innovation and vision to consumers who are naturally drawn to forward-thinking brands.

    Disruptive sales strategies go beyond mere transactions; they create innovative solutions that evoke strong emotional triggers like innovation and exclusivity, driving deeper engagement and brand loyalty. When a customer recognizes that a company offers unique and differentiated solutions that truly address their specific needs, it significantly increases the likelihood of closing deals and fostering long-term business growth.

    Learn More about Sales & Marketing in my latest book:

  • Measuring ROI with Data Analytics – Proving the Value of Marketing Spend

    Measuring ROI with Data Analytics – Proving the Value of Marketing Spend

    Justifying marketing spend is no longer optional—it’s essential. In an age where every decision is scrutinized for its financial impact, proving the return on investment (ROI) has become a non-negotiable part of modern marketing strategy. Finance and marketing departments are more interconnected than ever, with data analytics providing a bridge between creative strategies and measurable financial outcomes. Marketing leaders are not the only ones under pressure; finance professionals are increasingly relying on data-driven insights to assess the impact of marketing spend on the company’s overall performance.

    The complexity of today’s marketing landscape—encompassing digital, offline, and hybrid channels—has made tracking ROI more challenging, but also more necessary. No longer is it enough to point to vanity metrics like social media impressions or email open rates. Now, both marketing and finance teams are turning to more sophisticated analytics tools to pinpoint the KPIs that truly matter, like customer acquisition cost (CAC), customer lifetime value (LTV), and overall profitability.

    For finance professionals, data analytics offers a way to translate marketing activities into numbers that matter to the bottom line. It's about moving beyond broad metrics and focusing on the true financial impact of each campaign—whether through increased revenue, improved customer retention, or stronger brand equity. In fact, many finance teams now collaborate closely with marketing departments, ensuring that all strategies are grounded in data-driven projections and measurable outcomes.

    As businesses increasingly adopt multi-channel marketing, the need for more accurate attribution models has become urgent. The customer journey is no longer linear, and the traditional first-click or last-click attribution methods don’t capture the full picture. Understanding how each touchpoint influences a customer’s decision—whether it’s a Google ad, a social media post, or an email—is critical to measuring the effectiveness of each channel. Multi-touch attribution models allow both marketers and finance teams to assess the contribution of each interaction, making it easier to optimize budgets and prove the ROI across multiple touchpoints.

    In this chapter, we’ll explore how marketing and finance teams are leveraging data to measure ROI with precision, moving beyond vanity metrics and diving into the KPIs that reflect true business impact. We'll look at attribution models, which help track conversions across various touchpoints, and examine how companies like Unilever use data analytics to measure ROI across channels. As we explore the rise of real-time data dashboards, we’ll see how instant reporting can help marketing teams fine-tune campaigns and improve efficiency on the fly. Finally, we’ll examine how companies can balance short-term wins with long-term brand building, ensuring that marketing spend delivers sustained value.

    Moving Beyond Vanity Metrics: Defining Meaningful KPIs

    Before diving into data-driven metrics, it’s essential to understand that the approach to measuring success—just like pricing strategies—must be grounded in what delivers the most value to the business. In pricing, there’s a clear distinction between Cost-Based Pricing and Value-Based Pricing, and this same principle can be applied to how we view marketing metrics.

    Cost-Based Pricing involves setting prices based on production costs plus a markup. It focuses on internal factors: how much it costs to produce and deliver a product or service, followed by adding a fixed percentage to ensure profitability. This method prioritizes operational expenses and ensures that a company covers its costs. It’s a more straightforward, internally-focused pricing strategy, but it doesn’t take into account how much a customer is willing to pay or the unique benefits the product offers.

    In contrast, Value-Based Pricing is determined by the perceived value to the customer. Rather than looking internally at production costs, this approach focuses outward, considering the benefits the product provides to customers and what they’re willing to pay for those benefits. It aligns with how customers see the product, understanding its value relative to their needs and experiences. For example, luxury brands or innovative tech companies often use this strategy because customers are willing to pay a premium for perceived quality, uniqueness, or advanced features.

    This same shift from cost-based to value-based thinking can be applied to how businesses evaluate their marketing efforts. Instead of relying on internal metrics that simply “add up” (like social media impressions or ad clicks), companies need to shift toward KPIs that demonstrate real value—how marketing efforts translate into customer acquisition, retention, and ultimately, revenue. Just as value-based pricing aligns more closely with what customers are willing to pay, focusing on the right KPIs helps businesses understand how marketing truly drives business growth.

    In the early days of digital marketing, metrics like page views, social media likes, and email open rates were seen as signs of success. These vanity metrics—while easy to track—often fail to provide a true picture of how marketing activities contribute to business growth. To prove the real value of marketing spend, businesses must define and focus on key performance indicators (KPIs) that go beyond surface-level engagement and directly impact revenue, profitability, and customer retention.

    Vanity metrics can be misleading because they don’t always connect to actual business outcomes. For example, a social media post might generate thousands of likes or shares, but how does that translate into new customers, increased sales, or long-term loyalty? Similarly, high website traffic doesn’t necessarily mean higher conversions if the visitors aren’t engaging with your product or service meaningfully. True success lies in measuring metrics that tell you whether your marketing efforts are driving actual business results.

    This is where meaningful KPIs come into play. These are metrics that align directly with your business objectives and provide a clear understanding of marketing’s contribution to the bottom line. Some of the most impactful KPIs include:

    Customer Acquisition Cost (CAC): This measures how much it costs to acquire a new customer, including all marketing and sales expenses. It’s a key metric because it allows businesses to understand how efficient their marketing efforts are in driving new business. For example, if your marketing campaigns are driving plenty of leads but the CAC is too high, it might signal inefficiencies in the process.
    Customer Lifetime Value (LTV): LTV tells you how much revenue a customer is likely to generate over their entire relationship with your company. When compared to CAC, LTV helps determine the long-term profitability of customer acquisition efforts. A high LTV means that the cost of acquiring customers is worth it because they generate significant revenue over time. This is particularly important for subscription-based businesses where the value of a customer grows over time.
    Conversion Rate: This KPI measures the percentage of visitors or leads that take the desired action, such as making a purchase, signing up for a newsletter, or filling out a contact form. Tracking conversion rates helps businesses understand how effective their marketing efforts are at turning interest into action. A high conversion rate indicates that your messaging, targeting, and user experience are aligned with customer needs.
    Return on Ad Spend (ROAS): This metric shows how much revenue is generated for every dollar spent on advertising. It’s a critical metric for understanding the effectiveness of paid media campaigns. ROAS helps businesses determine which channels or ads are delivering the best return and where adjustments might be needed to improve efficiency.
    Customer Retention Rate: While acquiring new customers is essential, retaining them is just as important, if not more so. A high customer retention rate indicates that your marketing efforts aren’t just focused on one-time purchases, but on building long-term relationships. This is especially relevant for industries like SaaS or e-commerce, where loyal customers contribute significantly to long-term revenue.

    Defining these KPIs isn’t just about picking a few numbers that sound good on paper. It’s about ensuring they align with overall business goals. Finance professionals, for example, are increasingly using these metrics to evaluate the financial impact of marketing initiatives. They’re not interested in how many people clicked on an ad or opened an email; they want to know how much new business was generated and how efficiently it was done. By focusing on KPIs that tie directly to revenue and growth, both marketing and finance teams can align their efforts for maximum impact.

    For businesses that sell through multiple channels, KPIs can vary. E-commerce companies might focus heavily on conversion rates and ROAS, while B2B businesses could prioritize metrics like lead quality and customer retention. The key is to ensure that whatever metrics are chosen, they offer a clear path to measuring success and driving decision-making.

    One of the biggest challenges in shifting away from vanity metrics is the sheer volume of data available. It’s easy to get distracted by numbers that look impressive but don’t provide real insights. This is where data analytics tools come in, helping businesses cut through the noise and focus on the metrics that matter. Platforms like Google Analytics, HubSpot, or more specialized solutions like Tableau and Looker provide marketers and finance teams with the ability to track meaningful KPIs, analyze trends, and make data-driven decisions.

    Moving beyond vanity metrics is about more than just tracking performance; it’s about proving the value of marketing spend in a language the entire business understands. By focusing on the right KPIs, businesses can demonstrate how marketing activities contribute directly to profitability, customer growth, and long-term success. It’s no longer just about “likes” or “views”—it’s about driving real, measurable business outcomes.

    Attribution Models: Single-Touch vs. Multi-Touch Analytics

    One of the biggest challenges businesses face is understanding how different marketing efforts contribute to customer conversions. This is where attribution models come into play. Attribution models are frameworks that help marketers assign credit to various touchpoints in the customer journey, enabling them to determine which interactions are most effective at driving results.

    Traditionally, single-touch attribution models have been widely used. These models assign all of the conversion credit to a single touchpoint—whether it’s the first interaction a customer has with your brand or the last one before they make a purchase. While simple to implement, single-touch models often fail to capture the complexity of modern customer journeys, where consumers interact with a brand multiple times across different channels before making a decision.

    For instance, a customer might first encounter your brand through a Facebook ad, later read a blog post, sign up for a webinar, and finally click on an email link to make a purchase. In a first-touch attribution model, all the credit for that conversion would go to the Facebook ad, ignoring the impact of the email or blog post. Similarly, in a last-touch attribution model, all the credit would be given to the email, neglecting the importance of the earlier touchpoints that nurtured the customer along the way. These models can be overly simplistic, leaving marketers with an incomplete picture of what really drives conversions.

    In contrast, multi-touch attribution models take a more holistic approach, distributing credit across all of the touchpoints in the customer journey. This provides a more accurate representation of how different marketing efforts work together to move a prospect from awareness to conversion. By understanding how each interaction contributes to the overall outcome, businesses can better allocate their marketing resources and optimize campaigns for maximum effectiveness.

    There are several types of multi-touch attribution models, each offering a different way to assign credit:

    Linear Attribution: This model assigns equal credit to every touchpoint along the customer journey. For example, if a customer interacted with your brand five times before making a purchase, each of those touchpoints would receive 20% of the credit. Linear attribution is useful for businesses that want to understand how all marketing efforts contribute to a conversion, but it may not accurately reflect the varying levels of influence each touchpoint has.
    Time Decay Attribution: In this model, more credit is given to the touchpoints that occur closer to the conversion event. The idea is that the interactions that happen right before the purchase are more influential in pushing the customer to convert than earlier touchpoints. For instance, if a customer’s journey started with a Google search but ended with a personalized email, the email would receive more credit for the conversion under the time decay model. This approach is useful for understanding the immediate impact of late-stage interactions, such as retargeting ads or direct email campaigns.
    U-Shaped (Position-Based) Attribution: This model assigns the majority of the credit to the first and last interactions, with less credit given to the middle touchpoints. The rationale behind this model is that the first interaction plays a critical role in driving awareness, while the last interaction is key in sealing the deal. Middle touchpoints still receive some credit but are viewed as less influential in moving the customer to conversion.
    W-Shaped Attribution: A more advanced variation of the U-shaped model, the W-shaped model assigns significant credit to the first interaction, the lead creation point, and the final conversion touchpoint. Each of these key milestones receives equal weight, with the remaining credit distributed among the other touchpoints. This model is ideal for businesses that want to place extra emphasis on the most critical stages of the customer journey, while still accounting for the supporting interactions.

    The choice of attribution model depends on the goals of the business and the complexity of the customer journey. For companies with shorter sales cycles and fewer touchpoints, single-touch models may suffice. However, for businesses with longer sales processes—such as B2B companies or e-commerce brands—multi-touch attribution provides a more nuanced understanding of which marketing efforts are driving results.

    One of the most significant benefits of multi-touch attribution is that it allows businesses to make data-driven decisions about where to invest their marketing budgets. By identifying which touchpoints contribute most to conversions, companies can allocate resources to the channels and tactics that have the highest impact. For example, if an analysis shows that retargeting ads and email campaigns consistently play a critical role in conversions, marketers can shift more budget toward those areas while reducing spend on less effective channels.

    Multi-touch attribution also highlights the importance of nurturing prospects throughout the entire customer journey. In many cases, conversions are the result of multiple interactions over time, rather than a single isolated event. By understanding how different touchpoints work together, businesses can create more cohesive, integrated marketing strategies that guide customers seamlessly from awareness to decision.

    However, implementing multi-touch attribution models comes with its own set of challenges. Tracking customer interactions across multiple channels requires advanced data analytics tools and systems that can integrate data from disparate sources, such as web analytics, CRM platforms, and social media monitoring tools. Additionally, businesses need to ensure that they have accurate tracking mechanisms in place to capture each touchpoint along the way.

    Despite these challenges, the shift toward multi-touch attribution represents a more sophisticated and accurate way of measuring marketing performance. By moving beyond single-touch models and embracing a multi-touch approach, businesses can gain deeper insights into the true drivers of conversion and optimize their marketing strategies for long-term success.

    Case Study: How Unilever Used Data to Track ROI Across Multiple Channels

    Unilever, one of the world’s largest consumer goods companies, has long recognized the importance of data in optimizing its marketing strategies. With a diverse portfolio of brands across various product categories, Unilever's challenge is not just about running campaigns—it’s about measuring the return on investment (ROI) of each marketing initiative across multiple channels, both digital and traditional.

    To meet this challenge, Unilever turned to advanced data analytics to gain a clear understanding of how its marketing spend impacts revenue. Rather than relying on broad assumptions or siloed data, Unilever adopted an integrated, data-driven approach that leverages real-time analytics, multi-touch attribution models, and comprehensive dashboards to measure the effectiveness of its campaigns across platforms.

    One key campaign involved the promotion of one of its flagship personal care brands. The marketing team ran a mix of online ads, television commercials, social media campaigns, influencer collaborations, and in-store promotions. The goal was not only to increase brand awareness but also to drive product sales and enhance customer loyalty. However, with so many moving parts across multiple channels, it was essential for Unilever to have a precise understanding of which activities were driving the best results.

    To track ROI effectively, Unilever used a multi-touch attribution model that allowed them to assign credit to different marketing touchpoints throughout the customer journey. The company recognized that customers often engage with a brand in several ways before making a purchase—seeing a product on a social media post, researching it on a website, and then ultimately making the decision after watching a TV ad or encountering an in-store display. A single-touch attribution model, which assigns all the credit to the first or last interaction, would have oversimplified this complex journey.

    By adopting a multi-touch approach, Unilever was able to analyze how different touchpoints worked together to influence consumer behavior. For example, the data showed that while the online ads generated a significant amount of initial interest, it was the combination of social media influencer campaigns and in-store promotions that ultimately pushed consumers to make a purchase. Without this multi-touch analysis, Unilever might have over-invested in digital ads and underinvested in the promotional activities that were actually driving conversions.

    Unilever also integrated real-time data dashboards into its marketing workflow, allowing the team to monitor campaign performance on the fly. These dashboards provided a comprehensive view of key metrics like Return on Ad Spend (ROAS), conversion rates, and engagement across various platforms. Real-time reporting allowed Unilever to make adjustments to its campaigns while they were still running. For instance, if the dashboard showed that a specific digital ad wasn’t performing as expected, the team could tweak the creative or shift budget to another channel in real time, ensuring that marketing spend was optimized continuously.

    Another important insight came from geo-targeted data. Unilever discovered that certain regions responded better to particular forms of advertising. For example, customers in urban areas engaged more with influencer-led social media campaigns, while those in suburban and rural areas responded more strongly to traditional television and in-store promotions. Armed with these insights, Unilever adjusted its media mix accordingly, allocating more budget to influencer campaigns in cities and boosting TV spend in less densely populated areas. This localized approach allowed Unilever to maximize the ROI of each campaign in different markets.

    Moreover, Unilever leveraged customer behavioral data to enhance personalization efforts across digital channels. By analyzing website interaction patterns, the team could determine which products customers were most interested in based on their browsing behavior. Personalized email campaigns and retargeting ads were then deployed to re-engage customers who had shown interest in specific products but had not yet made a purchase. This level of targeted engagement proved highly effective, driving higher conversion rates and a strong return on investment.

    The holistic approach taken by Unilever illustrates the power of using data to inform marketing decisions. By combining multi-touch attribution with real-time reporting, the company was able to gain a granular view of its entire marketing ecosystem and optimize its efforts for better ROI. Not only did this approach help Unilever track which campaigns were delivering the most value, but it also provided valuable insights into consumer behavior and regional preferences, allowing the brand to tailor its marketing strategies more effectively.

    In addition to improving short-term performance, Unilever’s data-driven approach also helped the company measure the long-term impact of its marketing spend. By tracking the full customer journey and analyzing customer retention rates, Unilever was able to assess how well its campaigns were driving loyalty and repeat purchases over time. This focus on both immediate conversions and long-term customer value allowed Unilever to maintain a balanced marketing strategy that supported both revenue growth and brand-building objectives.

    This case study demonstrates how a global brand like Unilever can leverage data analytics to improve marketing efficiency, optimize campaign performance, and ultimately prove the value of marketing spend. By taking a comprehensive, data-driven approach, Unilever not only maximized its ROI but also gained a deeper understanding of its customers and the effectiveness of its marketing channels.

    The Rise of Data Dashboards: Real-Time Reporting for Marketing Efficiency

    Today marketing campaigns run across multiple platforms, channels, and regions, staying on top of performance metrics can be a challenge. This is where data dashboards have revolutionized the way marketers track, measure, and optimize their efforts. These dashboards provide real-time reporting, allowing marketing teams to instantly visualize campaign performance and make swift decisions to maximize efficiency and return on investment (ROI).

    Before the advent of data dashboards, marketing teams often relied on fragmented reporting systems, pulling data from different platforms like Google Analytics, CRM software, or social media analytics tools. This process was often manual, time-consuming, and prone to errors. By the time data was gathered, analyzed, and presented, it was often too late to make real-time adjustments, meaning that many campaigns ran inefficiently until they concluded.

    Today, real-time data dashboards offer a centralized platform that integrates data from multiple sources, providing marketing teams with a single view of all campaign activities. With these dashboards, businesses can monitor critical metrics like conversion rates, customer acquisition cost (CAC), return on ad spend (ROAS), and engagement rates across various channels—all in real time. The ability to have this comprehensive view allows marketers to make informed decisions and adjust campaigns while they’re still running.

    One of the biggest advantages of real-time reporting is the ability to course-correct immediately. For example, if a paid search campaign is generating a lot of clicks but few conversions, a dashboard would allow the team to identify the issue instantly. Rather than waiting until the end of the campaign to analyze performance, marketers can optimize targeting, adjust bids, tweak ad copy, or shift budgets to better-performing channels in real time. This ensures that marketing spend is continually optimized for maximum effectiveness.

    Additionally, real-time dashboards enable better collaboration between marketing and finance teams. With access to the same data, finance professionals can keep a close eye on marketing spend and ROI, ensuring that budgets are aligned with the most impactful efforts. By eliminating the delay between campaign execution and financial reporting, businesses can move faster and make more strategic decisions.

    Data dashboards also allow for customization, meaning that marketers can focus on the KPIs that matter most to their specific campaigns. For example, a direct-to-consumer e-commerce brand may prioritize metrics like average order value and cart abandonment rates, while a B2B company might focus more on lead generation and sales pipeline velocity. Dashboards can be tailored to display the data that aligns with business goals, ensuring that teams are always focused on the right metrics.

    For companies running multi-channel campaigns, data dashboards provide an invaluable view of how each channel contributes to the overall performance. By integrating data from various sources, such as Google Ads, Facebook, email marketing platforms, and e-commerce analytics tools, marketers can see how their efforts are working together. For instance, a brand might discover that while social media is driving traffic, it’s the email retargeting campaigns that are converting those visitors into customers. Understanding the interplay between different channels allows businesses to allocate resources more effectively and optimize their marketing mix for better ROI.

    Another significant advantage of data dashboards is their role in predictive analytics. Beyond just showing what’s happening in real time, advanced dashboards can provide predictive insights, helping marketers anticipate future trends and campaign outcomes. By analyzing historical data and current trends, dashboards can offer recommendations on how to adjust strategies before issues arise. For example, if a product category is trending based on current traffic and sales patterns, dashboards can recommend shifting budget to capitalize on the momentum, boosting the overall ROI of the campaign.

    Moreover, real-time dashboards improve accountability and transparency across teams. With all stakeholders having access to the same real-time data, it becomes easier to hold departments accountable for campaign outcomes. Whether it's the marketing team assessing creative performance or the finance team tracking the effectiveness of spend, data dashboards create a shared understanding of how well the business is performing in relation to its marketing goals.

    For global businesses, data dashboards are especially powerful. They allow marketing teams to track performance across different regions and markets, identifying where certain campaigns or product lines are performing better or worse. This granular view helps brands adjust strategies based on localized trends and customer preferences. For example, a global company might discover that a specific type of digital content performs exceptionally well in one market but underperforms in another. By having real-time insights into each region’s performance, the company can adapt its messaging and budget allocation accordingly, optimizing results at a global scale.

    The rise of data dashboards represents a significant leap forward in marketing efficiency. With the ability to see what’s happening in real time, make informed decisions on the fly, and measure campaign performance across channels and regions, businesses are more empowered than ever to optimize their marketing efforts. By eliminating guesswork and providing data-backed insights, dashboards are not only improving ROI but also helping businesses stay agile in a fast-paced marketing landscape.

    Calculating and Optimizing ROI with Data-Driven Insights

    Calculating and optimizing Return on Investment (ROI) has become a fundamental necessity for marketers. Data-driven insights offer the clarity needed to accurately assess the effectiveness of campaigns, identify the highest-impact strategies, and ensure that marketing spend is being used efficiently. Gone are the days when marketers had to rely on gut feeling or basic metrics to evaluate performance. With the wealth of data now available, companies can make more informed, precise decisions that lead to higher profitability and better resource allocation.

    Calculating ROI involves determining how much value marketing efforts generate relative to the costs involved. The formula is simple:

    ROI = Revenue−Cost×100

    Total Costs

    However, calculating ROI becomes more complex when businesses need to track multiple campaigns across different channels. Digital advertising, content marketing, email campaigns, and social media all contribute to the final result, but each with its own metrics. This complexity is where data-driven insights come into play. By leveraging data from all available sources, businesses can accurately determine which efforts are delivering the highest ROI and where resources might be better allocated.

    One of the primary advantages of using data analytics to calculate ROI is the ability to track performance in real time. Rather than waiting until the end of a campaign to assess its effectiveness, marketers can use dashboards and analytics tools to monitor ongoing performance and make adjustments as needed. If a specific channel is underperforming, teams can quickly reallocate budget, refine messaging, or adjust targeting to improve the ROI of that campaign. This continuous optimization ensures that every dollar spent is working toward achieving the business's broader goals.

    For example, a company running both paid search ads and a content marketing campaign can analyze the performance of each channel. If the data shows that paid search ads are generating significantly higher conversion rates at a lower Customer Acquisition Cost (CAC), it might make sense to allocate more of the marketing budget toward search ads while optimizing the content marketing strategy. The ability to assess campaigns dynamically ensures that businesses can pivot and refine their tactics on the go, leading to more efficient spending and higher returns.

    Multi-channel marketing also makes calculating ROI more challenging because consumers rarely interact with just one channel before making a purchasing decision. A potential customer might first encounter a brand through a social media ad, subscribe to the brand’s newsletter, receive a targeted email, and then finally make a purchase after clicking a paid search ad. In such cases, assigning the right credit to each touchpoint is critical to accurately calculate ROI. Businesses need to rely on multi-touch attribution models to determine which interactions contribute most to conversions, thus painting a clearer picture of how each marketing effort is contributing to overall ROI.

    In addition to attribution models, predictive analytics are playing an increasingly important role in optimizing ROI. Predictive tools analyze historical performance data to forecast future campaign outcomes, helping businesses anticipate which strategies are most likely to yield the best returns. For example, if a business consistently sees higher conversion rates when running seasonal promotions, predictive models can recommend launching similar campaigns during high-traffic periods, maximizing the impact of marketing spend.

    A/B testing is another essential tool for optimizing ROI. By running experiments with different versions of ads, landing pages, or email content, businesses can quickly determine which elements resonate most with their audience. For instance, a company might test two different ad headlines to see which one generates higher click-through rates. By continuously testing and refining marketing assets, businesses can improve their overall effectiveness, leading to higher conversion rates and improved ROI over time.

    Data-driven insights also help businesses optimize long-term ROI, not just short-term campaign performance. For example, tracking Customer Lifetime Value (LTV) can provide valuable insights into the long-term profitability of acquiring and retaining customers. A business that spends heavily on acquisition might see short-term success, but if those customers don’t stick around, the long-term ROI suffers. By using data to understand which types of customers have the highest LTV, businesses can tailor their acquisition strategies to focus on leads that are more likely to deliver sustainable, long-term value. This focus on LTV helps companies build stronger customer relationships and improve profitability in the long run.

    Segmenting audiences is another way data-driven insights help marketers optimize ROI. Not all customers respond to the same messaging or offers, so tailoring campaigns to different audience segments can significantly improve performance. For instance, a business might find that one segment of customers responds better to discount offers, while another values premium content or exclusivity. By delivering the right message to the right audience, businesses can improve engagement, conversion rates, and ultimately, ROI.

    Additionally, data-driven insights allow businesses to optimize budget allocation by identifying which channels are delivering the best returns. Through data analytics, companies can assess the performance of every dollar spent across different platforms, adjusting budgets to favor the highest-performing channels. For example, if social media ads are outperforming display ads, businesses can shift more budget toward social, maximizing the impact of their marketing spend.

    Lastly, tracking and optimizing ROI with data also enables businesses to justify marketing spend to key stakeholders, including finance teams and executives. By presenting concrete data that links marketing activities to revenue, customer acquisition, or brand growth, marketers can demonstrate the value of their campaigns in quantifiable terms. This transparency is crucial for securing future budgets and aligning marketing efforts with the company’s overall financial objectives.

    Maximizing ROI through data-driven insights is no longer optional—it's critical for any business striving to stay ahead in a dynamic market. By tapping into real-time data, predictive analytics, A/B testing, and multi-touch attribution, marketers can craft strategies that not only deliver results but do so efficiently. Data-backed decisions give businesses the power to enhance their marketing impact while continually optimizing ROI for long-term success.

    How to Track and Measure Long-Term Impact vs. Short-Term Marketing Efforts

    There’s often a heavy emphasis on immediate results—short-term wins that drive quick conversions, boost traffic, or generate leads. While these short-term metrics are important, businesses that focus solely on them risk overlooking the broader picture: the long-term impact of their marketing efforts. Balancing the need for short-term gains with long-term brand building and customer loyalty is essential for sustainable success.

    Short-term marketing efforts typically involve campaigns designed to produce immediate results, such as flash sales, pay-per-click (PPC) advertising, or product launches. These campaigns can be highly effective at driving quick spikes in traffic, conversions, or revenue, but their effects often fade quickly once the campaign ends. For example, a discount promotion might attract new customers in the moment, but without a retention strategy in place, those customers may not stick around for repeat business, limiting the overall value of the campaign.

    On the other hand, long-term marketing efforts focus on building lasting relationships with customers, enhancing brand reputation, and driving sustainable growth over time. These strategies often include content marketing, brand storytelling, customer experience improvements, and loyalty programs. While the results may take longer to materialize, long-term strategies are key to driving Customer Lifetime Value (LTV) and ensuring that customers continue to engage with your brand well after their initial purchase.

    To strike the right balance between short-term and long-term goals, businesses must carefully track and measure the performance of both types of marketing efforts. This requires a dual approach to metrics, with a focus on both immediate conversions and long-term customer engagement.

    Measuring Short-Term Impact

    Short-term marketing efforts are often easy to measure because their goals are clear and time-bound. The KPIs for short-term campaigns usually include metrics like:

    Conversion Rate: How many people are taking the desired action—whether it’s making a purchase, filling out a form, or signing up for a newsletter—within a specific time frame. This KPI helps businesses assess the immediate success of their campaigns.
    Customer Acquisition Cost (CAC): For campaigns focused on acquiring new customers quickly, CAC is a key metric that shows how much it costs to bring in each new customer. A low CAC indicates that the short-term campaign is generating cost-effective results.
    Return on Ad Spend (ROAS): ROAS measures how much revenue a business earns for each dollar spent on advertising. For short-term campaigns, this metric is essential for understanding the financial effectiveness of marketing spend.
    Website Traffic & Engagement: Immediate spikes in website traffic, page views, and time on site can indicate that a short-term campaign is generating interest. These metrics can help businesses understand how well their campaigns are attracting attention and whether visitors are engaging with the content.

    While these metrics provide valuable insights into the immediate performance of marketing efforts, they don’t always capture the long-term value those efforts generate. That’s why businesses must also track the lasting effects of their marketing strategies.

    Measuring Long-Term Impact

    Long-term impact can be more challenging to measure because the results unfold over months or even years. However, the metrics that track long-term performance are crucial for understanding the overall value of marketing efforts and their contribution to business growth. Some of the most important long-term KPIs include:

    Customer Lifetime Value (LTV): LTV measures the total revenue a business can expect to earn from a customer over the course of their relationship. This metric is essential for long-term planning because it shows whether your marketing efforts are attracting high-value customers who will contribute to sustained growth. For businesses that rely on repeat purchases or subscriptions, LTV is a key indicator of long-term success.
    Customer Retention Rate: While acquiring new customers is important, retaining existing customers is even more valuable in the long run. A high retention rate indicates that your marketing efforts are fostering strong customer relationships, leading to repeat business and greater brand loyalty.
    Brand Awareness and Perception: Over time, effective marketing efforts should enhance brand awareness and strengthen the perception of your company in the marketplace. Surveys, social listening tools, and brand tracking studies can help businesses measure how their brand is viewed over time, allowing them to assess the impact of long-term strategies like content marketing and public relations.
    Engagement Metrics: Long-term engagement metrics—such as email open rates, social media interactions, and content downloads—provide insights into how well your brand is maintaining customer interest. Regular engagement is a sign that customers remain connected to your brand, which can lead to higher LTV and stronger customer relationships.
    Organic Search Growth: Another key indicator of long-term success is the growth in organic search traffic. Content marketing, SEO, and brand-building efforts often take time to yield results, but over time, increased visibility on search engines leads to more sustainable, cost-effective traffic. Organic search growth also reflects the strength of your online presence and your ability to attract inbound interest without relying heavily on paid advertising.

    Balancing Short-Term and Long-Term Strategies

    To optimize both short- and long-term performance, businesses need to take a balanced approach to their marketing strategies. Short-term campaigns can drive immediate results and help meet quarterly goals, but they should be designed to complement longer-term brand-building efforts. For example, a short-term promotion can attract new customers, but combining it with a loyalty program or personalized follow-up emails can help convert those customers into long-term, loyal clients.

    Data analytics plays a key role in this balancing act. By tracking short-term metrics in real time and monitoring long-term trends, businesses can fine-tune their strategies to achieve both immediate success and sustainable growth. Tools like Google Analytics, CRM systems, and predictive analytics platforms allow marketers to track customer behavior over time, helping them identify which efforts are driving short-term conversions and which ones are contributing to long-term customer retention and brand equity.

    Moreover, businesses need to align short-term marketing goals with their long-term vision. For example, if the goal is to build a premium brand, short-term promotions that focus solely on discounts may hurt long-term brand perception. Instead, short-term campaigns should be crafted in a way that supports the brand’s core values, ensuring that both immediate and long-term marketing efforts are working toward the same objectives.

    So, tracking and measuring both short- and long-term marketing impact is essential for creating a sustainable growth strategy. Short-term campaigns may deliver quick wins, but it’s the long-term strategies that build brand loyalty, foster customer retention, and generate ongoing revenue. By balancing the two, businesses can achieve meaningful, lasting success.

  • Personalization at Scale – The Holy Grail of Customer Experience

    Personalization at Scale – The Holy Grail of Customer Experience

    This is Chapter 6 of my book: Introduction to Sales & Marketing Data Analytics.

    Personalization is no longer just a trend—it’s the future of customer engagement, and those who master it will dominate their industries. We live in a world where customers expect every interaction to feel tailor-made, whether they’re browsing an e-commerce site, watching their favorite streaming service, or scrolling through social media. It’s no longer enough to address customers by their first name in an email or recommend products based on generic categories. Today’s consumers want experiences that feel deeply personal, like the brand knows them inside and out, and this is where personalization at scale becomes the game-changer.

    The beauty—and the challenge—of personalization is delivering it at scale. How do you create hyper-targeted, individualized experiences for millions of customers without manually crafting each one? This is where data, automation, and artificial intelligence (AI) come into play, driving personalized recommendations, real-time content delivery, and one-to-one marketing on a massive scale. Think of companies like Netflix, Amazon, and Spotify—they’ve set the bar for personalized customer experiences by leveraging vast datasets and advanced algorithms to serve relevant, meaningful content to millions of users simultaneously.

    But here’s the key: scale and relevance must go hand in hand. It’s not just about automating a few personalized messages—it’s about creating an ecosystem where every touchpoint feels like a conversation tailored to each customer’s preferences, behaviors, and needs. When done right, personalization at scale drives engagement, boosts conversion rates, and builds long-term loyalty. When done poorly, it risks coming across as cold, invasive, or—even worse—creepy.

    In this chapter, we’ll break down the science behind algorithm-driven recommendations, explore real-world examples like Netflix, and discuss how brands can balance automation with the human touch to create impactful customer experiences. You’ll learn how to deliver the right message, to the right person, at the right time—without losing the personal touch that makes customers feel truly valued.

    The future of marketing is one-to-one, powered by AI and driven by data. But with great power comes great responsibility, especially when it comes to maintaining trust and privacy. As we explore the intricacies of personalization, we’ll also look at how brands can avoid crossing the line, ensuring that their efforts enhance the customer experience without stepping into uncomfortable territory.

    The Science Behind Personalized Recommendations: Algorithms and Customer Journeys

    The ability to deliver personalized recommendations has become the backbone of modern marketing and customer experience strategies. It’s what allows brands to go beyond generic messages and offer customers a sense of individuality—whether through product suggestions, tailored content, or curated services. But what powers these seemingly intuitive recommendations is a complex system of algorithms that continuously learn from customer interactions. Understanding this science is key to mastering the art of personalization at scale.

    At the core of personalized recommendations are algorithms—sets of rules and mathematical models that process vast amounts of data to make predictions about a customer’s preferences. But not all algorithms are the same. There are two primary approaches that brands use to personalize recommendations: collaborative filtering and content-based filtering. These methods often work in tandem to create the most accurate and timely suggestions.

    Collaborative filtering is one of the most commonly used approaches. It works by analyzing patterns of behavior across a large group of users. For example, collaborative filtering looks at the behavior of similar users—what they browse, purchase, or engage with—and predicts that another customer with comparable behavior will likely enjoy the same things. It’s akin to the idea that “customers like you also bought this” or “people who watched this movie also watched that one.” This method doesn’t require deep knowledge of the actual product or content, but rather, it relies on finding correlations between different users’ behaviors.

    For instance, think of a streaming platform recommending a movie based on viewing patterns across millions of users. Collaborative filtering analyzes trends within these massive data sets, identifying what viewers with similar tastes enjoy. The more customers interact with the platform, the smarter the recommendations become. This ability to scale and improve over time is what makes collaborative filtering so powerful—it learns from the behaviors of the crowd and adjusts its predictions accordingly.

    On the other hand, content-based filtering focuses more directly on individual preferences. Unlike collaborative filtering, which compares user behavior across a broad spectrum, content-based filtering examines the characteristics of the items a particular customer has interacted with. For example, if someone has consistently purchased or shown interest in running shoes, content-based filtering will suggest other products that share similar attributes—such as style, brand, or material. It’s a more tailored approach that aligns closely with the specific interests and actions of the individual customer.

    This method ensures that the recommendations feel more personal and relevant. By analyzing the attributes of each item and matching them to the customer’s known preferences, content-based filtering can create a more focused experience. In practice, this means a fashion retailer won’t just recommend random clothing items, but instead will suggest pieces that align with a customer’s specific style or past purchases. It becomes less about what others are buying and more about what fits that particular person’s preferences.

    Now, while these algorithms are incredibly powerful on their own, their true potential is unlocked when they are strategically woven into the customer journey. This is where timing and context come into play. It’s not just about providing the right recommendation; it’s about doing so at the right moment, when the customer is most open to engaging with it.

    For example, a customer who has been browsing workout gear may not be ready to purchase immediately. However, if they receive a well-timed email later in the day with personalized recommendations based on their browsing history, they may be more likely to return and make a purchase. The key is to deliver the recommendation at a point in the journey where it feels like a natural extension of the customer’s experience, rather than a hard sales push.

    A critical aspect of this process is data integration. For personalized recommendations to work effectively, companies need to gather data from multiple touchpoints—whether it’s the customer’s behavior on the website, interactions with an app, past purchases, or even responses to marketing emails. All of this data feeds into the recommendation engine, allowing the algorithms to create a more complete picture of the customer. The more data the system has, the better its ability to predict what the customer will want next.

    Take a platform like Coursera, an online education provider. It doesn’t just recommend courses based on the last subject you studied. It analyzes your entire learning journey—past courses, completion rates, even your interaction with certain types of content—to suggest the next best course. Whether you’re looking to build a new skill set or dive deeper into an existing one, the recommendations feel personalized to your growth path, making the experience far more engaging than a generic “you might like this” suggestion.

    The real value of personalized recommendations lies in how they enhance the discovery process. When done right, these recommendations don’t just push products or services—they introduce customers to new things they didn’t know they needed or wanted. This discovery creates a sense of excitement and engagement, as customers feel like the brand is helping them find exactly what they’re looking for, even before they realize it themselves.

    However, it’s important to recognize that personalization is only as effective as the data it’s built on. If the data is inaccurate or outdated, the recommendations will feel irrelevant or misplaced. Brands must continuously refine their data collection processes and ensure that their algorithms are learning in real-time. This is where machine learning comes in, as it allows recommendation engines to constantly adapt based on new customer inputs, keeping the experience fresh and personalized.

    Moreover, while automation plays a huge role in driving these recommendations, brands must be careful not to over-automate. Customers still appreciate a human touch in their interactions. Combining algorithm-driven insights with manual customer insights—like feedback from customer service teams or social media interactions—helps brands strike the right balance. This approach ensures that personalization feels genuine and not just robotic.

    In the end, the science behind personalized recommendations is about delivering value at every stage of the customer journey. It’s about using data to anticipate needs and creating a seamless experience where every interaction feels tailored, relevant, and, most importantly, personal. When brands get this right, they don’t just increase conversions—they build lasting relationships with customers who feel understood and valued.

    Netflix Logo

    Case Study: How Netflix Achieves a Personalized Experience for Millions

    When it comes to personalization at scale, Netflix is often seen as the benchmark. With over 200 million subscribers worldwide, the platform delivers a highly individualized experience to each user, making it seem like the service was tailor-made for them. But how does Netflix pull this off across such a vast and diverse audience? The answer lies in the combination of data-driven insights, algorithmic precision, and a deep understanding of human behavior.

    At the heart of Netflix’s personalization strategy is its sophisticated recommendation engine. The platform tracks every interaction users have with the service, from the shows they watch to how long they watch them, whether they pause or rewind, and even how they scroll through the menu. This wealth of data is then processed through Netflix’s algorithms, which analyze viewing habits, genres, actors, and even subtle preferences like the time of day users watch content. It’s all aimed at predicting what a user will want to watch next, with the ultimate goal of keeping them engaged with the platform for as long as possible.

    One of the key innovations behind Netflix’s approach is the way it personalizes the user interface. Unlike traditional streaming platforms where everyone sees the same list of popular shows or new releases, Netflix tailors its interface for each individual. The thumbnails, categories, and recommendations a user sees are all based on their personal preferences. For example, if a user tends to watch thrillers, Netflix might surface those types of shows at the top of their feed. But it goes deeper than that—Netflix will also adjust the thumbnail images to appeal to specific interests. So, for someone who watches a lot of crime dramas, the thumbnail for a comedy might feature a dark, edgy image rather than a lighthearted one, making it more likely to capture that user’s attention.

    Netflix’s data-driven personalization extends beyond just suggesting shows. The company also focuses on the context in which users watch content. For instance, Netflix has learned that many users have different viewing habits depending on the time of day or the device they’re using. Someone watching Netflix on their phone during a commute might get recommendations for shorter shows or stand-up comedy specials, while the same person might see different suggestions when browsing at home on their TV, where they’re more likely to commit to longer movies or series.

    But personalization on this scale doesn’t just happen overnight. Netflix’s algorithms are continually refined using A/B testing. The company constantly runs experiments on different groups of users to test everything from thumbnail images to content placement on the homepage. Through these tests, Netflix gathers data on what drives user engagement and satisfaction, which in turn informs the algorithms. It’s an iterative process that allows Netflix to continuously optimize its recommendations.

    What’s particularly impressive about Netflix’s personalization is how it navigates the balance between automation and human creativity. While the algorithms handle the heavy lifting in terms of analyzing data and predicting preferences, Netflix’s content teams still play a crucial role in curating the right mix of shows, movies, and original content. This human element ensures that the platform remains fresh and exciting, with content that aligns with broader cultural trends and user interests.

    An important part of Netflix’s success is its ability to handle global scale without sacrificing personalization. With subscribers in more than 190 countries, Netflix has to account for vast differences in culture, language, and content preferences. To do this, the platform’s recommendation engine is not just a one-size-fits-all solution—it’s designed to be hyper-localized. In India, for example, Netflix’s algorithms may prioritize Bollywood films or regional TV shows, while users in Japan might see more anime and local dramas. Despite the global reach, Netflix ensures that each user feels like their content choices are specifically catered to their tastes and culture.

    However, Netflix’s ability to deliver such a personalized experience also raises questions around data privacy and the potential for over-personalization. While most users appreciate the convenience of tailored recommendations, there’s always the risk that too much personalization can feel invasive. Netflix has managed this well by being transparent about how it uses data. The platform allows users to adjust their settings, offering control over what data is collected and how recommendations are made. This transparency builds trust and ensures that users feel comfortable with the level of personalization they receive.

    The real genius of Netflix’s personalized experience is that it doesn’t feel robotic or forced. The platform uses data to create a seamless experience where users naturally discover content they love, without feeling like they’re being manipulated. This balance between intelligent recommendations and user autonomy is what makes Netflix’s approach so effective. It feels like the platform knows you, but in a way that enhances your experience rather than intrudes on it.

    Looking ahead, Netflix’s personalization strategy will only become more advanced as AI and machine learning continue to evolve. The company is already experimenting with predictive models that can anticipate not just what a user might want to watch next, but what content they’ll enjoy six months or a year down the line. This level of personalization, driven by long-term behavioral insights, has the potential to make Netflix an even more integral part of its users’ daily lives.

    Netflix’s ability to personalize at scale is a masterclass in data-driven marketing. By combining user behavior with algorithmic precision and creative curation, Netflix delivers an experience that feels deeply personal to each of its millions of users. It’s not just about keeping viewers on the platform longer—it’s about making them feel understood and valued, one show at a time.

    See content credentials

    Delivering Tailored Content, Ads, and Product Recommendations in Real-Time

    Consumers have come to expect immediacy—whether it’s in the content they consume, the ads they see, or the product recommendations they receive. The ability to deliver real-time personalization has become a critical differentiator for brands looking to engage customers at the right moment. It’s not just about sending the right message but about delivering that message exactly when it matters most.

    Real-time personalization is made possible through a blend of data collection, advanced algorithms, and instantaneous processing. Modern systems have the capability to gather data from every touchpoint a customer interacts with, process that information in milliseconds, and respond with tailored content or product recommendations. The result? Customers feel like the brand is truly attuned to their needs in that exact moment, making the experience both relevant and seamless.

    Take the example of real-time product recommendations in an e-commerce environment. When a user is browsing an online store, algorithms work in the background to analyze their current behavior—what items they’re looking at, how much time they spend on certain pages, and whether they’ve added anything to their cart. Based on this data, the system can suggest related products, display personalized offers, or show accessories that complement the items they’re considering. This all happens in real-time, creating an experience where the customer feels guided through their shopping journey, as if the brand intuitively understands what they need next.

    Real-time personalization extends beyond just product recommendations. It also plays a significant role in the content that brands serve to their customers. For example, media companies and news platforms tailor the articles or videos shown to users based on their viewing history, preferences, and real-time browsing behavior. Imagine a user visiting a news website to read a particular story. As they scroll, the platform can instantly recommend other articles based on that specific interest, ensuring the user stays engaged for longer. This continuous cycle of personalized content keeps users immersed in the platform, driving both engagement and loyalty.

    The same principle applies to advertising. Real-time personalization in ads takes what used to be broad, generic messaging and transforms it into highly targeted, relevant content delivered at just the right moment. For instance, a user who has recently searched for vacation rentals might start seeing real-time ads for flight deals, local tours, or hotel recommendations based on their current location and browsing history. Platforms like Google Ads and Facebook Ads use dynamic ad-serving technologies that pull from live data to make sure the ads reflect exactly what the customer is most likely to engage with at that moment.

    But delivering personalized content or ads in real-time goes beyond just relevance. It’s about timing. The ability to capture a customer’s attention at the perfect moment is a powerful tool in driving conversions. Imagine you’re shopping online for a new winter jacket. After browsing for a while, you decide to hold off on purchasing. Later that day, as you scroll through your social media feed, you’re served an ad for the same jacket—this time with a limited-time discount. This kind of real-time, context-aware personalization is what nudges customers from consideration to conversion, and it’s the hallmark of an effective personalized marketing strategy.

    Retailers have also embraced real-time personalization in physical stores through the use of beacon technology and location-based marketing. Beacons are small devices placed within stores that can communicate with a shopper’s smartphone via Bluetooth. If a customer has the retailer’s app installed, the beacon can trigger personalized offers or product recommendations as soon as they enter a specific section of the store. For example, as a customer walks by the shoe section, they might receive a notification with a discount on the exact type of shoes they’ve been browsing online. This blend of physical and digital personalization creates a truly omnichannel experience, where the customer journey feels cohesive and interconnected no matter where they are.

    One of the key drivers behind real-time personalization is the rise of customer data platforms (CDPs) and machine learning. These technologies allow brands to aggregate data from various sources, analyze it in real-time, and trigger personalized actions instantly. For example, CDPs can combine data from a customer’s in-store purchase history, online browsing habits, social media activity, and email interactions to create a comprehensive profile. This profile is continuously updated as new data comes in, allowing the system to make better, more personalized recommendations in real time.

    The advantage of machine learning in real-time personalization is its ability to anticipate customer needs rather than simply react to them. Machine learning models can analyze vast amounts of data and predict what a customer might want next, even before they’ve taken any action. This predictive capability allows brands to preemptively offer solutions or products, further enhancing the customer experience. For example, a streaming platform might recommend a new show to a user based on their viewing patterns before they’ve even finished their current series. Or an airline might offer a flight upgrade at a critical moment in the booking process, based on the customer’s past travel preferences.

    Of course, delivering personalized content, ads, and product recommendations in real-time requires a delicate balance. While personalization is powerful, it’s important that it doesn’t feel invasive or overwhelming. If customers sense that a brand is watching their every move, it can create discomfort and erode trust. The key to successful real-time personalization is making it feel natural—like a helpful suggestion rather than a sales tactic.

    Maintaining transparency and ensuring that customers are aware of how their data is being used is essential to building trust in real-time personalization efforts. Brands that respect privacy while still delivering value through personalization are more likely to build lasting relationships with their customers.

    The brands that can effectively leverage real-time personalization will create experiences that feel dynamic, responsive, and, most importantly, relevant to the customer’s immediate needs. Whether it’s a perfectly timed product recommendation, a well-placed ad, or a timely piece of content, real-time personalization is the key to driving engagement, loyalty, and conversions in today’s fast-paced, data-driven world.

    Scaling Personalization: Balancing Automation and Manual Customer Insights

    As companies grow and their customer bases expand, one of the most significant challenges they face is how to scale personalization without losing the human touch. Personalization, when done well, builds a deeper connection with customers, but achieving this on a large scale requires a delicate balance between automation and manual insights. The trick is to leverage technology efficiently while still maintaining an element of human oversight that keeps the experience feeling genuine and relevant.

    Automation plays a critical role in making personalization scalable. With millions of customers interacting with a brand through various touchpoints—whether it’s via email, social media, websites, or physical stores—manually crafting unique experiences for each individual is impossible. This is where automation steps in, enabling companies to gather, analyze, and act on customer data in real-time without human intervention. Systems driven by AI and machine learning can process vast amounts of information, segmenting customers based on their behaviors, preferences, and interactions, and then delivering personalized content, recommendations, or offers at the right moment.

    Take the example of a global retail brand like Zara, which sells to millions of customers across different countries and regions. Automating customer segmentation based on purchasing history, location, and browsing behavior allows Zara to recommend relevant products to customers in a way that feels personal, even though it’s powered by machine learning. Customers browsing winter jackets in New York during November may receive real-time suggestions for matching scarves or gloves, while customers in warmer climates might see lighter options like raincoats or fall accessories. This automated approach makes personalization seamless across massive audiences.

    However, the risk with fully automated systems is that personalization can start to feel impersonal if it’s entirely driven by data and algorithms. This is where manual customer insights come into play. While AI and machine learning provide efficiency and scale, manual insights—often gathered from customer service interactions, surveys, social media engagement, or direct feedback—add the human element back into the equation. These insights can highlight nuances that algorithms might miss, such as emotional drivers behind purchases, shifts in consumer sentiment, or subtle cultural preferences.

    For example, Warby Parker, the direct-to-consumer eyewear brand, excels at balancing automation with manual insights. While much of their customer data is collected and analyzed through automated systems—tracking what styles customers view, try on, and purchase—the company also relies heavily on feedback from its customer service teams and in-store interactions to shape its personalization strategies. Warby Parker’s customer service representatives gather qualitative insights, such as customer preferences for fit, color, and lifestyle needs, which are then integrated into their broader personalization strategy. By combining these human insights with automated data collection, the brand ensures that its recommendations don’t just reflect purchase patterns but also the emotions and preferences that drive those purchases.

    One area where balancing automation and manual insights is critical is in the realm of email marketing. Automated email campaigns driven by customer data can feel highly personal—suggesting products based on browsing history or sending birthday discounts—but if overused, they can quickly become generic and lose their impact. On the other hand, manually crafted emails, based on real conversations or personalized customer feedback, may resonate more deeply, but they’re not scalable for large audiences.

    The best email marketing strategies combine both approaches. For instance, a company might automate the process of sending follow-up emails after a customer makes a purchase, but integrate manual touches like product recommendations based on recent customer service interactions. This ensures that the customer feels cared for on a personal level, without overwhelming the marketing team with labor-intensive tasks.

    Scaling personalization also requires companies to get smarter about how they use automation. Not all customers need the same level of personalized attention. High-value customers, for example, may warrant more manual, high-touch interactions—perhaps receiving personalized phone calls, VIP offers, or invitations to exclusive events. Meanwhile, for lower-value customers, automated systems can handle the bulk of the personalization, ensuring that everyone receives a level of customization, but in a more cost-effective and scalable way.

    This tiered approach is used by companies like Sephora, which tailors its personalization strategy based on customer lifetime value (CLV). High-spending customers receive more personalized, human-driven experiences, such as one-on-one beauty consultations or early access to new product lines. Meanwhile, automation handles personalized email offers, product recommendations, and loyalty program updates for the broader customer base, ensuring that every customer feels valued while maximizing efficiency.

    As AI and machine learning continue to evolve, the lines between automation and manual insights will become increasingly blurred. AI-driven systems are starting to become more adept at capturing the subtle emotional and cultural factors that typically require human intervention. For example, natural language processing (NLP) technologies can analyze customer feedback from surveys or social media and identify key emotional drivers, allowing brands to adjust their messaging in real-time. This ability to combine emotional intelligence with data processing makes it easier for brands to maintain personalization at scale, without losing the human touch.

    However, there’s a danger in relying too heavily on automation without regularly incorporating human oversight. Algorithms can occasionally produce recommendations that feel out of touch or irrelevant because they lack the contextual understanding that comes from direct customer interaction. To counter this, brands need to continuously monitor their automated systems and regularly input fresh manual insights. This can come from social listening tools, customer service teams, or even in-store conversations that capture how customers are feeling and what they value most.

    Scaling personalization is about finding the right balance. Automation provides the foundation for efficiency and consistency, but manual insights are what keep the experience human and relatable. By blending the two, brands can deliver tailored experiences to millions of customers without sacrificing quality or connection.

    As companies continue to refine their personalization strategies, the future will likely see even more seamless integration of AI-driven automation and human insight, leading to personalization experiences that are not only scalable but deeply meaningful to each individual customer.

    Hyper-Personalization: The Future of One-to-One Marketing Through AI

    As customer expectations continue to evolve, the future of marketing is increasingly centered on hyper-personalization—the next level of one-to-one marketing, where brands tailor experiences down to the individual in real-time. This level of personalization goes beyond segmenting customers by demographics or general behaviors; it digs deeper, using AI, machine learning, and real-time data to predict and respond to customer needs before they even arise. Hyper-personalization is about creating unique, relevant experiences for each customer, at every point of their journey, in a way that feels almost intuitive.

    Hyper-personalization leverages AI and machine learning to process vast amounts of data from multiple touchpoints—such as browsing behavior, purchase history, location data, and even real-time interactions on websites or apps. These technologies enable brands to create incredibly precise, individualized marketing messages that align with a customer’s immediate context. This level of specificity is what sets hyper-personalization apart from more traditional forms of personalization, which are typically based on broader segments.

    A prime example of hyper-personalization is seen in how Starbucks uses AI in its mobile app. The app analyzes data such as past purchases, preferred store locations, and even the time of day a customer typically orders to suggest highly personalized offers and recommendations. If you usually grab a latte on your morning commute, the app might suggest trying a new seasonal flavor just before you reach your usual store, or offer a discount on a breakfast sandwich that pairs with your favorite drink. The entire experience feels uniquely tailored to the individual, and it happens automatically, driven by real-time data.

    What makes hyper-personalization truly powerful is its predictive capabilities. AI isn’t just reacting to what the customer has done in the past—it’s predicting what they’ll want next. For instance, a health and wellness app might monitor a user’s workout routines, dietary habits, and even sleep patterns to deliver personalized recommendations for fitness programs, recipes, or supplements. If the app detects that a user has increased their workout intensity, it might suggest products that support muscle recovery or offer tips on adjusting nutrition to match the new level of activity. This level of predictive personalization ensures that the brand is always a step ahead, anticipating the customer’s needs before they even articulate them.

    But hyper-personalization doesn’t stop at product recommendations or content. It also extends to dynamic pricing and offers. For instance, e-commerce companies can use hyper-personalization to adjust prices in real-time based on individual customer behaviors and willingness to pay. A frequent shopper might receive exclusive discounts based on their loyalty, while a first-time visitor might be offered a special promotion to encourage conversion. This dynamic approach to pricing ensures that offers are not only personalized but also strategically aligned with each customer’s perceived value to the brand.

    One of the most significant benefits of hyper-personalization is that it allows brands to create immersive, seamless customer experiences. Consider how Nike has integrated hyper-personalization into its fitness ecosystem. Through apps like Nike Run Club and Nike Training Club, the company tracks every aspect of a user’s workout habits—miles run, goals set, even the type of terrain they prefer. Based on this data, Nike delivers hyper-personalized content, including customized workout plans, shoe recommendations tailored to the user’s running style, and motivational messages to keep them on track. The user feels as though the brand is supporting them personally, which fosters deep loyalty and engagement.

    Hyper-personalization also allows brands to deliver content in real-time, adapted to the customer’s current context. Imagine a customer browsing a luxury car brand’s website. Through hyper-personalization, the brand can detect not just which models the customer is interested in, but also their location, the time of day, and their browsing history. If the customer is near a dealership, they might receive a personalized invitation to schedule a test drive. If they’re visiting the website at night, they might be shown a high-gloss video showcasing the car’s sleek interior lighting features. This level of personalization makes the experience feel tailored and timely, enhancing the customer’s connection to the brand.

    AI-driven hyper-personalization can also be applied in email marketing. Rather than sending out generic emails to large segments of customers, AI can generate unique content for each recipient based on their past interactions with the brand. This could include personalized product recommendations, custom discount codes, or even tailored subject lines that align with the customer’s preferences and behaviors. The result is an email experience that feels genuinely personal—more like a one-on-one conversation than a broad marketing effort.

    While hyper-personalization offers a wealth of opportunities for brands to connect with customers, it also comes with challenges—the most significant of which is maintaining customer trust. With hyper-personalization comes the risk of overstepping, where customers may feel that the brand knows too much about them or is using their data in ways that feel invasive. To avoid this, brands must strike the right balance between delivering value and respecting privacy. Transparency is key—customers need to understand how their data is being used and, more importantly, how it benefits them.

    A study by Accenture found that 83% of consumers are willing to share their data for a more personalized experience, but they also expect transparency and control over how that data is used. This underscores the importance of data ethics in hyper-personalization. Brands that are open about their data practices, and that offer customers options to manage their privacy, will build stronger, more trusting relationships.

    As we look to the future, the potential for hyper-personalization is virtually limitless. With AI continuing to evolve, brands will have even greater capabilities to deliver one-to-one experiences that are contextually relevant, emotionally resonant, and predictive. We’re already seeing innovations in natural language processing (NLP) and AI-driven content creation, where machines can generate personalized articles, video scripts, or product descriptions tailored to each individual. The result is marketing that doesn’t just feel personalized—it’s uniquely crafted for every customer interaction.

    Hyper-personalization represents the future of marketing. It takes the promise of one-to-one engagement and makes it scalable through AI and data-driven insights. Brands that invest in this level of personalization will not only enhance the customer experience but also build deep, long-lasting relationships that drive loyalty and revenue.

    Avoiding the “Creepy Factor”: Respecting Privacy While Providing Personalized Experiences

    As brands continue to push the boundaries of personalization, there’s an increasingly fine line between delivering a highly relevant experience and creeping out the customer. This is often referred to as the “creepy factor”—the moment when personalization feels too invasive, making customers uncomfortable with how much a brand seems to know about them. As companies leverage more sophisticated technologies like AI and machine learning to gather data and predict customer behavior, it becomes crucial to balance personalization with privacy. The challenge is to deliver value through personalized experiences without crossing that invisible line into feeling intrusive.

    So, how do brands avoid the creepy factor while still harnessing the power of personalization? It starts with transparency and ensuring customers feel in control of their data. In a world where consumers are more aware than ever about data collection practices, respecting their privacy is not just a regulatory obligation—it’s a competitive advantage. A transparent approach to data usage builds trust, and that trust is the foundation of any successful personalized marketing effort.

    One of the key strategies for maintaining transparency is offering customers control over their data. This means giving users the ability to opt in or out of certain types of data collection, as well as providing clear information on how their data is being used. Brands like Apple have leaned heavily into this model, positioning privacy as a core part of their value proposition. Apple’s marketing emphasizes its commitment to protecting user data, which has helped the company foster a strong trust relationship with its customer base. Even though Apple uses customer data to personalize experiences—whether through app recommendations or tailored news—it does so in a way that makes users feel empowered and in control.

    Similarly, Spotify offers users control over the data that informs their music recommendations. While Spotify uses vast amounts of data to hyper-personalize playlists and music suggestions, it provides users with the ability to influence the algorithm by liking or skipping tracks, thus making the personalization feel less like an imposition and more like a mutual relationship between the user and the platform.

    Another way to avoid the creepy factor is by ensuring that personalization is value-driven rather than data-driven for the sake of it. Customers are generally more comfortable sharing data when they see a clear benefit. For instance, when an online retailer like Nordstrom suggests products based on past purchases, or when a travel company like Expedia recommends destinations based on prior trips, customers can see the direct benefit of sharing their preferences. The personalization feels helpful because it saves them time and improves their experience, rather than feeling like an invasion of privacy.

    However, personalization can cross the line when it feels too precise or when the timing is off. Imagine browsing for a new pair of shoes online, and suddenly you’re bombarded with ads for that same pair across every website you visit, even after you’ve made the purchase. This type of overly aggressive retargeting can make customers feel as though they’re being stalked. To prevent this, brands need to implement frequency caps and smart retargeting strategies that respect the customer’s journey without overwhelming them. Personalization should enhance the experience, not dominate it.

    The timing of personalized offers also plays a huge role in whether customers perceive them as helpful or intrusive. Well-timed recommendations feel intuitive, while poorly timed ones can come off as invasive. For example, receiving a product recommendation based on a purchase from several months ago feels off and irrelevant, whereas a recommendation delivered right after an interaction (such as adding an item to the cart) feels timely and useful. This is where real-time data and contextual understanding become essential. Brands need to be sensitive to the customer’s current context—whether they’re actively shopping, just browsing, or even resting between sessions—to deliver personalization that feels natural.

    Cultural sensitivity is another aspect of avoiding the creepy factor. Personalization strategies that work in one region or demographic may not work in another. For instance, customers in North America might be more accustomed to personalized email offers, while customers in Europe, where GDPR privacy regulations are stricter, might be more skeptical of overly personalized marketing. Understanding and adapting to these cultural and regulatory differences is key to ensuring that personalization efforts are seen as a positive rather than an intrusion.

    Brands must also be mindful of over-personalization—delivering too much too soon. Customers might appreciate a personalized product recommendation, but if the brand starts predicting things like what they might want to eat for dinner based on their location or search history, it can start to feel like an overreach. The goal is to strike the right balance—personalizing enough to provide value without crossing into territory where the customer feels uncomfortable. This balance can be achieved by prioritizing relevance over sheer personalization. Instead of trying to personalize every detail, brands should focus on delivering the most relevant and meaningful experiences.

    One of the most critical factors in maintaining this balance is data security. In an era of increasing data breaches and privacy scandals, customers are rightfully concerned about how their data is being protected. Brands that prioritize robust data security measures, communicate these measures clearly, and demonstrate that they are handling customer data responsibly will gain an edge in building trust. Companies like Google and Microsoft have made significant investments in data security and privacy features, helping to mitigate concerns around how user data is collected and stored. Customers are more willing to engage with personalization efforts when they know their data is safe.

    Looking ahead, personalization strategies will continue to evolve, and brands will need to stay ahead of emerging privacy concerns. Technologies like blockchain may offer future solutions for ensuring that customer data is both secure and transparent, giving users even more control over their personal information. Brands that invest in privacy-first personalization will be better positioned to build long-lasting, trusted relationships with their customers.

    Avoiding the creepy factor is about respecting boundaries while still delivering meaningful, relevant experiences. Personalization should feel like a natural part of the customer journey, not an intrusion. By prioritizing transparency, giving customers control over their data, ensuring proper timing, and delivering clear value, brands can create personalization strategies that build trust and loyalty rather than discomfort.

    #DigitalMarketing, #MarketingStrategy, #MarketingTrends, #ContentMarketing, #MarketingInnovation, #Personalization, #MarketingAutomation, #CustomerJourney, #MarketingAnalytics, #BrandStrategy, #CustomerExperience, #CustomerEngagement, #CustomerSatisfaction, #CXInnovation, #CustomerRetention, #CustomerInsights, #CustomerCentric, #CustomerLoyalty, #CXTrends, #RealTimeMarketing, #MarTech, #BigData, #DataDriven, #PredictiveAnalytics, #AIinMarketing, #DataVisualization, #MachineLearning, #DataScience, #RealtimeAnalytics, #TechInnovation, #TargetedAds, #ContentCreation, #AdTech, #ProgrammaticAdvertising, #CreativeAdvertising, #DynamicContent, #TailoredContent, #ContentStrategy, #PersonalizedMarketing, #ContentDistribution, #FutureOfWork, #BusinessGrowth, #InnovationStrategy, #GrowthHacking, #DisruptiveInnovation, #EcommerceTrends, #DigitalTransformation, #ThoughtLeadership, #FutureOfMarketing, #ScalingSuccess

  • The Power of Data-Driven Marketing and Sales

    The Power of Data-Driven Marketing and Sales

    Have you ever stopped to consider how much data is flowing through your business every single day? In today’s world, every click, every interaction, every transaction leaves a digital footprint. Now think about this: are you truly harnessing that power? Are you leveraging this wealth of information to optimize your marketing efforts or transform your sales approach? Data isn’t just another trend; it’s the foundation of how modern businesses operate, especially when it comes to marketing and sales. If you’re still relying on intuition or gut feelings to make key decisions, it’s time to shift gears. The companies that lead in today’s market are those that have transitioned from intuition-based strategies to data-driven, real-time decision-making.

    For much of human history, decision-making in business was guided primarily by intuition, experience, and observation. Whether in marketing, sales, or product development, leaders relied on gut instincts and a broad understanding of their market. Although some level of research and data gathering existed, it was often rudimentary, with insights coming from customer feedback, surveys, or general market trends. Data, as we know it today, didn’t play a significant role in shaping business strategy.

    However, as industries evolved and technology advanced, so did the methods for understanding customers and driving business decisions. The transition from intuition-based decision-making to a data-driven approach marks one of the most important shifts in modern business history. In this chapter, we’ll explore the stages of this evolution, from its humble beginnings to the transformative impact of Big Data, and how businesses today are operating in a new era defined by data-driven insights.

    For much of the 20th century, businesses operated in what could be described as an "intuition-based" framework. Executives and managers would make decisions based on their accumulated experience, industry knowledge, and a broad understanding of market trends. Advertising agencies, for example, relied heavily on creativity and general audience insights. A famous campaign, like Volkswagen’s iconic "Think Small" ad, was created from a deep understanding of consumer psychology but with very little empirical data to back it up.

    During this era, most businesses gathered limited amounts of data. Customer feedback was typically obtained through surveys, focus groups, or anecdotal evidence. Companies would run campaigns, measure their broad impact, and then refine their strategies based on the results. However, this feedback loop was slow, and the insights were often vague and generalized.

    Market research began to take shape in the 1950s and 1960s, but even then, data collection was costly, time-consuming, and often out of reach for smaller businesses. The data that was collected was mostly qualitative, and it was hard to link specific actions or strategies to measurable business outcomes. In short, while businesses tried to understand their customers, their approach was largely guesswork, backed by intuition and limited observation.

    The first major shift towards data in decision-making began in the late 1960s and 1970s with the advent of computerized systems. These systems allowed businesses to store and process larger amounts of information than ever before. The initial application of these technologies was largely operational—improving supply chain efficiency, inventory management, and customer records. Companies like IBM started developing early forms of databases that could hold structured data, enabling businesses to keep track of transactions, customers, and other business activities more effectively.

    Although these systems were primitive by today’s standards, they laid the foundation for the data-driven future. Businesses now had access to a repository of structured information that could, in theory, be analyzed for insights. However, these systems were expensive and complex, limiting their use to large organizations with substantial resources. For most businesses, decision-making was still largely based on human intuition.

    The true tipping point came with the rise of the internet in the 1990s. Suddenly, businesses had access to vast amounts of digital data. Every interaction online—from website visits to email clicks—could be tracked, measured, and analyzed. This was a monumental shift from the days of survey-based insights, as businesses could now collect real-time data on customer behaviors and preferences. The internet opened the floodgates to what we now call Big Data.

    Companies like Google, Amazon, and eBay were pioneers in leveraging this new wealth of digital information. Google, for instance, began refining its search algorithms based on user data, learning from every search query to improve its service. Amazon, on the other hand, started using customer data to create personalized shopping experiences. Their recommendation engine became one of the first widely recognized examples of a company leveraging data to drive business outcomes. It wasn’t just about knowing that a customer bought a book; it was about understanding their preferences and predicting what they might want next.

    For businesses of all sizes, the internet marked the beginning of a new era in which data wasn’t just something you collected—it was something you could actively use to refine your strategies. Analytics tools like Google Analytics emerged, giving companies access to data about who visited their websites, what pages they clicked on, and how long they stayed. Marketers suddenly had the power to test campaigns in real time, adjusting their strategies based on immediate feedback.

    This shift represented a significant move away from intuition. While gut feelings and creative thinking still played a role, businesses now had the data to validate or challenge their assumptions. Marketing teams, for example, could run A/B tests on campaigns and determine within hours which version was more effective. Sales teams could analyze data to identify patterns in customer behavior, adjusting their approaches to close more deals.

    By the 2010s, the term “Big Data” became a buzzword, marking the next phase in the evolution of data-driven decision-making. With the rise of social media, mobile devices, and e-commerce, the amount of data being generated exploded. Every interaction, purchase, review, and like created a data point that could be analyzed to reveal deeper insights about customer behavior.

    At this stage, businesses moved from simply collecting data to truly analyzing it in sophisticated ways. Technologies like Hadoop and cloud computing allowed for the storage and processing of vast amounts of unstructured data. This was crucial because, for the first time, businesses could analyze not only transactional data but also behavioral and social data, giving them a 360-degree view of their customers.

    Machine learning further accelerated this transformation. Instead of manually analyzing data, businesses could now build algorithms that would learn from the data and make predictions. Companies like Netflix and Spotify began using machine learning to recommend content to users, based on what similar users had watched or listened to in the past. The key difference was that these systems were dynamic: they improved as they received more data, creating a feedback loop that constantly refined and personalized the customer experience.

    In sales, predictive analytics became a game-changer. By analyzing historical data, machine learning algorithms could predict which leads were most likely to convert, allowing sales teams to prioritize their efforts on high-value prospects. This shift from reactive to proactive decision-making was another significant step in the journey from intuition to data.

    Today, Data Analytics is no longer a luxury or an experimental tool for large companies; it is a necessity for businesses of all sizes. The evolution from intuition to data-driven decision-making is complete. Businesses that rely solely on gut feelings or traditional methods are quickly falling behind. Data-driven companies are more agile, responsive, and better positioned to anticipate customer needs, optimize their operations, and outmaneuver competitors.

    One of the most remarkable aspects of today’s data-driven era is how accessible data has become. Powerful analytics tools are available at relatively low costs, making it possible for even small businesses to harness the power of data. Companies can track customer interactions across multiple channels—social media, email, websites, and apps—and use that information to refine their strategies in real-time.

    Moreover, the future promises even more exciting developments. Artificial Intelligence (AI) is continuing to evolve, offering even more sophisticated ways to process and analyze data. Businesses are now moving toward real-time data processing, where decisions can be made instantaneously based on live customer interactions. This level of agility allows businesses to pivot on the fly, adapting to changing market conditions and consumer preferences faster than ever before.

    The journey from intuition-based decision-making to a data-driven approach has fundamentally transformed the way businesses operate. Where decisions were once made based on gut feelings and broad assumptions, they are now informed by data that reveals precise customer behaviors, preferences, and trends. This shift has unlocked new levels of efficiency, personalization, and growth for businesses across all industries.

    As we move forward, the companies that continue to embrace and refine their use of Data Analytics will thrive. Those who rely solely on intuition will struggle to keep pace in a world that demands real-time insights and adaptability. In this new era, data is not just a tool—it’s the foundation upon which the future of business is built.

    Data Democratization

    How Data Democratization is Transforming Decision-Making

    In the past, data analysis was confined to the walls of IT departments or specialized teams of analysts. Only a select few had access to the raw data, tools, and expertise needed to extract insights, leaving decision-making in the hands of those with specialized knowledge. For years, data was seen as a resource that could only be tapped by those with technical know-how, meaning that the majority of the workforce operated without the critical insights that data could provide.

    Today, that reality has been flipped upside down. The process known as data democratization has emerged as a major force, fundamentally transforming the way businesses operate. Data is no longer the property of a small group of specialists; it has become an accessible asset available to employees across all levels and departments. As data democratization spreads, businesses are seeing a shift in decision-making, from top-down processes led by executives to collaborative, data-informed strategies executed by teams at all levels. It has empowered people throughout organizations to make smarter, faster, and more evidence-based decisions.

    This transformation didn't happen overnight, nor is it complete. But its effects are already reshaping industries and allowing businesses to become more agile, competitive, and customer-focused. To understand the profound impact of data democratization, we need to dive into the drivers of this change, its implications, and the challenges it presents.

    One of the main forces behind data democratization has been the rise of user-friendly data tools and platforms. A few decades ago, data analysis required programming expertise, and insights were typically drawn from static reports that could take days or even weeks to generate. Platforms like SAP, Oracle, and IBM, while powerful, were often complex, intimidating, and accessible only to technical teams.

    The situation began to change with the emergence of modern, self-service analytics tools like Tableau, Google Analytics, Power BI, and Looker, among others. These platforms were designed not for technical specialists but for business users, allowing people in marketing, sales, HR, and finance to analyze data without needing to understand SQL or complex code. Visual dashboards and drag-and-drop interfaces made it possible for anyone to explore data, spot trends, and generate reports in a matter of minutes. This ease of access gave non-technical users the power to ask and answer their own business questions, without waiting for data analysts to step in.

    Furthermore, cloud computing and Software as a Service (SaaS) models have accelerated this shift by making powerful analytics platforms available on demand without the need for heavy upfront infrastructure investments. Tools like Google Cloud and AWS offer scalable data storage and processing capabilities, allowing businesses of all sizes to collect, store, and analyze large datasets affordably. The availability of data tools has expanded beyond the IT department to virtually every desk, enabling all employees to take a hands-on approach to data-driven decision-making.

    In traditional business models, data was often siloed within departments, and the information flow between them was minimal. Marketing teams might have one set of data, sales another, and product development yet another. This lack of integration led to fragmented decision-making, where each department made choices based on incomplete pictures of the business.

    With data democratization, those silos are breaking down. By giving employees across departments access to the same data, businesses can foster a culture of collaboration. Teams are able to work together more seamlessly, informed by shared insights. A marketing team, for instance, can now easily access sales data to understand which campaigns are driving the most revenue. Similarly, product development can use customer service data to prioritize features that customers are asking for.

    The benefits of this cross-functional insight are enormous. Consider a scenario where the marketing department launches a new campaign. In a traditional setup, they would only have access to high-level engagement metrics like click-through rates or conversions, without knowing how those conversions ultimately impacted sales or customer satisfaction. But in a democratized data environment, they can see sales performance, customer feedback, and even product return rates, giving them a holistic view of the campaign’s effectiveness.

    This flow of information across departments enables more coherent and aligned decision-making. When data is accessible to everyone, teams can not only work more efficiently but also make smarter, more informed decisions that benefit the business as a whole.

    Nowadays speed is everything. Traditional decision-making processes often relied on historical data, which meant that by the time a decision was made, the context could have already shifted. However, with democratized data and the widespread availability of real-time analytics, businesses are now able to respond instantly to changes in the market or shifts in customer behavior.

    For instance, e-commerce platforms can track user activity in real-time, using that data to adjust marketing strategies, tailor recommendations, and push personalized offers. In the past, this kind of data-driven adjustment might have taken days or weeks to analyze and implement. Today, companies can use real-time data to tweak campaigns or promotions almost instantly, optimizing them for maximum impact.

    The ability to access real-time insights also empowers employees to make decisions on the fly, without needing to wait for approval from higher-ups. Sales teams, for instance, can react to real-time insights about which products are selling the fastest or which customers are engaging with specific offers, adjusting their pitch or focus accordingly. This level of agility simply wasn’t possible in a pre-data democratization world.

    Consider the example of Spotify, which uses real-time data to personalize music recommendations for millions of users. Every song played, every playlist created, and every artist followed generates data that informs their recommendation algorithms. Employees across departments, from marketing to product development, have access to these insights, allowing them to respond quickly to user preferences and trends. This real-time decision-making process ensures that Spotify stays ahead of its competitors, constantly evolving to meet the ever-changing needs of its users.

    Data democratization isn't just about giving access to data; it's also about empowering people to understand and use that data effectively. With the right tools, non-technical users can now perform sophisticated analyses that were once the exclusive domain of data scientists. However, this shift requires an emphasis on data literacy—the ability for non-experts to read, understand, and interpret data meaningfully.

    As organizations adopt a democratized approach to data, they are increasingly investing in data literacy programs to upskill their workforce. These programs help employees develop the skills they need to draw meaningful insights from data and use those insights to inform their decisions. Training typically covers understanding key metrics, working with visual dashboards, and recognizing trends and patterns. This new level of data literacy enables employees to engage with data proactively, leading to a culture where evidence-based decisions become the norm.

    A prime example of this is General Electric (GE), which has invested heavily in training its workforce in data literacy. By giving its employees the tools and training to work with data, GE has transformed its business from an industrial giant to a digital leader. Employees across departments now have the skills to analyze operational data, allowing them to predict equipment failures, optimize maintenance schedules, and improve overall productivity. This shift has led to millions of dollars in cost savings and has strengthened GE’s competitive advantage in the marketplace.

    While data democratization offers numerous benefits, it’s not without its challenges. One of the primary concerns is the risk of data overload. When everyone has access to vast amounts of data, it can be overwhelming to sort through and find the insights that truly matter. Without proper training and guidance, employees might misinterpret data, leading to poor decisions or analysis paralysis.

    Another concern is data security. As more employees gain access to sensitive data, the risk of data breaches or misuse increases. Businesses must ensure that they implement proper governance and security measures to protect sensitive information, including personal customer data and proprietary business insights. This requires a balance between making data accessible and ensuring that only authorized individuals have access to certain types of information.

    Finally, there’s the challenge of maintaining data accuracy. With data flowing freely throughout an organization, inconsistencies or inaccuracies can spread quickly. It’s essential for businesses to establish data quality standards and ensure that employees understand how to interpret data correctly, particularly when working with real-time or complex datasets.

    Despite these challenges, the benefits of data democratization far outweigh the risks. By empowering employees across an organization to access, analyze, and act on data, businesses can make faster, smarter decisions that drive growth and innovation.

    Examples of Companies Like Amazon and Netflix Revolutionizing Through Data Analytics

    Data Analytics has completely transformed the way businesses operate, especially in the world of marketing and sales. Companies like Amazon and Netflix have become global giants not just because they offer great products and services, but because they have mastered the art of using data to understand, predict, and influence customer behavior. From analyzing every click, scroll, and interaction on their platforms to harnessing predictive algorithms, these companies have fundamentally changed the way businesses approach customer engagement, personalization, and growth. Let’s dive into how Amazon and Netflix have revolutionized their industries using Data Analytics—and what we can learn from their success.

    Amazon and Netflix are two of the most prominent examples of companies that have completely revolutionized their industries using Data Analytics. Both organizations have transformed how we shop, watch content, and interact with digital platforms, largely because of their unparalleled ability to gather, analyze, and act on data. These companies use Data Analytics not just as a tool but as the very foundation of their business models, driving growth, personalization, and customer satisfaction at an unprecedented scale.

    Amazon, the e-commerce giant, is perhaps the most iconic example of how Data Analytics can shape an entire industry. Every single interaction you have with Amazon is tracked, analyzed, and used to enhance your experience. From the moment you land on the homepage to the instant you check out, Amazon is collecting data—every search query, every product viewed, and even the time spent lingering on specific pages or hovering over products. Even subtle behaviors, like the movement of your mouse cursor, are analyzed to understand your intent and preferences. The power of this data lies in how Amazon uses it to personalize every aspect of your shopping journey.

    One of the most well-known applications of Amazon’s Data Analytics prowess is its recommendation engine. When you browse Amazon, you’re not just seeing a random assortment of products; you’re being shown items specifically tailored to your past behavior, browsing history, and purchase habits. Amazon's recommendation engine analyzes millions of data points, not only from your interactions but also from the behaviors of millions of other customers with similar preferences. This system doesn’t just recommend products you’ve previously bought or looked at—it goes much deeper, predicting what you might want next based on complex patterns of purchasing behavior.

    For example, if you’ve been purchasing baby products recently, Amazon might start suggesting items like parenting books, toys, or child-proofing equipment. This goes beyond just responding to immediate needs; it anticipates what you might require in the near future, based on the buying journeys of other customers. This predictive capacity, powered by sophisticated algorithms, accounts for an estimated 35% of Amazon’s total sales. The more customers interact with the platform, the more data Amazon collects, which in turn makes its recommendations even more accurate and personalized.

    But Amazon’s use of data isn’t limited to the front-end customer experience. Behind the scenes, Data Analytics plays a pivotal role in shaping its supply chain, logistics, and pricing strategies. Amazon employs dynamic pricing, which means the price of a product can fluctuate based on demand, competitive pricing, and customer behavior. This real-time adjustment ensures that Amazon remains competitive in a fast-moving e-commerce landscape. For example, if a competitor lowers the price of a product, Amazon's system can detect that change and adjust its own pricing to remain attractive to customers. The same goes for peak shopping periods, such as Black Friday or the holiday season, where demand spikes can lead to price increases. All of these decisions are driven by data, ensuring Amazon can maximize both revenue and customer satisfaction.

    Another area where Amazon excels through data is its supply chain management. Amazon’s vast network of fulfillment centers is a logistical marvel, and it’s all powered by data. Amazon doesn’t just track inventory levels—it predicts demand. By analyzing historical sales data, seasonal trends, and regional preferences, Amazon can strategically stock items in specific warehouses, allowing for faster shipping times and reduced costs. This kind of predictive inventory management is what enables Amazon to offer services like same-day or next-day delivery, which has become one of its most significant competitive advantages. The company’s ability to anticipate what customers will order and where they will order it from allows it to optimize its entire logistics chain, making it both faster and more efficient.

    Customer service is another domain where Amazon leverages data to improve the user experience. The company closely monitors customer feedback, product reviews, and service requests to detect patterns of dissatisfaction. For instance, if multiple customers start leaving negative reviews for a particular product, Amazon’s system can flag the issue for further investigation or removal from listings. Additionally, data helps Amazon proactively address potential pain points, such as delayed shipments or issues with returns, by identifying these problems before they escalate.

    Netflix, like Amazon, has built its business on the foundation of Data Analytics, but its approach focuses on content consumption and personalization. Every time you watch a show, pause a movie, skip a series, or give a thumbs-up to a title, Netflix is collecting data. Every interaction feed into its recommendation system, which is designed to predict what you’ll want to watch next with stunning accuracy. This isn’t just about offering popular content—it’s about offering the right content for you, at the right time.

    Netflix’s recommendation engine is one of the most advanced in the world. It doesn’t just rely on what you’ve previously watched; it considers a vast array of variables, including the time of day, the type of device you’re using, how long you typically spend watching certain genres, and even how quickly you binge through a series. Netflix analyzes all of this data to predict not just what you might enjoy, but what will keep you watching longer. This focus on maximizing engagement is a key factor in Netflix’s ability to keep its subscribers happy and reduce churn.

    One of the most fascinating aspects of Netflix’s data strategy is how it uses insights from user behavior to guide its content production decisions. The success of Netflix’s original programming, like Stranger Things and House of Cards, wasn’t based on creative intuition alone—it was driven by data. Netflix analyzed viewer data to determine which types of shows and genres were most popular among its users, which actors or directors drew the most attention, and what kinds of stories were likely to resonate with specific audiences. By using data to inform content production, Netflix has been able to invest in programming that is almost guaranteed to succeed with its target audience.

    Beyond recommendations, Netflix also uses real-time data to optimize its platform. For instance, if a particular show or movie is trending in a specific region, Netflix can promote that content more heavily in that area. The platform can also adjust its marketing campaigns on the fly, depending on how users interact with its content. This ability to react in real time is what gives Netflix an edge over traditional media companies, allowing it to be more agile and responsive to audience preferences.

    Netflix’s data-driven approach extends to how it manages bandwidth and streaming quality. By analyzing viewing patterns, Netflix can predict peak streaming times and allocate resources, accordingly, ensuring that users experience minimal buffering or interruptions. This focus on delivering a seamless viewing experience is another way Netflix uses data to retain customers and enhance their overall satisfaction.

    In both Amazon and Netflix, the use of Data Analytics has gone far beyond simply tracking customer behavior. These companies have built entire ecosystems around data, using it to drive everything from personalized recommendations and dynamic pricing to supply chain optimization and content production. Every click, every mouse movement, every decision a customer makes feeds into a system that continuously learns, improves, and evolves. This is the true power of Data Analytics—not just collecting data, but using it to transform the customer experience and drive business success.

    The success of these companies serves as a model for how other businesses can leverage Data Analytics to not only keep pace with their competition but to lead their industries. The takeaway is clear: those who can harness the power of data will be the ones shaping the future of commerce, entertainment, and beyond.

    The Role of Data in Optimizing Customer Journeys and Sales Funnels

    Understanding your customer is the key to success. However, in the past, much of this understanding relied on broad market research, intuition, and retrospective analysis of campaigns or sales performance. Today, with the rise of Data Analytics, companies are no longer navigating blindly—they are optimizing customer journeys and sales funnels with laser precision. Data provides real-time insights into every stage of the customer experience, allowing businesses to make data-driven decisions that improve engagement, streamline the buying process, and ultimately boost revenue.

    Optimizing each touchpoint of the customer journey can be the difference between converting a lead and losing them to a competitor. Data plays an essential role in uncovering inefficiencies, identifying drop-off points, and personalizing experiences that meet the specific needs of each customer. Whether it's guiding a customer from the moment they first engage with a brand or helping sales teams prioritize leads, data ensures that every step of the journey is as seamless and effective as possible.

    The customer journey today is anything but linear. Customers interact with businesses across multiple channels—social media, websites, emails, in-store visits, apps—and at different times of the day. Traditionally, understanding how a customer moves through this complex web of touchpoints required broad assumptions and qualitative analysis. Data has changed that.

    Using Data Analytics, businesses can now map out the entire customer journey with pinpoint accuracy. Every interaction a customer has with a brand is a data point: clicking on an ad, visiting a website, signing up for a newsletter, engaging with social media posts, or speaking to customer service. By aggregating and analyzing these data points, businesses can see not just where customers are coming from, but how they move through the funnel and, more importantly, where they drop off.

    For instance, imagine a customer begins by clicking on a Facebook ad for a product, then visits the website, browses a few products, adds something to their cart, and finally leaves without making a purchase. This customer journey, once fragmented and difficult to track, is now fully visible through Data Analytics. Businesses can analyze this behavior to see where customers are abandoning their carts and implement strategies to re-engage them—whether through personalized email campaigns, retargeting ads, or by addressing potential pain points that might be slowing down the purchase process (such as confusing website navigation or unexpected shipping costs).

    In this way, data doesn't just reveal what the customer did, but why they did it. It helps businesses identify patterns and bottlenecks, allowing them to make proactive changes that improve conversion rates.

    Personalization is no longer a luxury—it's an expectation. Today’s customers are used to brands like Amazon, Netflix, and Spotify offering tailored recommendations, product suggestions, and experiences based on their preferences and behaviors. The companies that succeed in this personalized approach are the ones that use data most effectively to understand their customers on an individual level.

    By collecting and analyzing data on customer preferences, buying history, and browsing habits, businesses can create highly personalized experiences at every stage of the journey. For example, if a customer frequently browses a particular category of products but hasn’t yet made a purchase, businesses can use data to automatically recommend similar items or offer personalized promotions to incentivize the sale. This kind of personalization doesn’t just apply to product recommendations; it can extend to the content a customer sees, the ads they are served, and even the messaging they receive in emails or on social media.

    Data also plays a key role in determining the right timing for engagement. If a customer typically engages with email offers in the evening, data-driven automation tools can adjust delivery times to match their behavior, increasing the likelihood of a click or conversion. Likewise, businesses can use real-time data to send push notifications or retargeting ads when a customer shows signs of interest, such as visiting a product page multiple times or spending significant time comparing options.

    The ability to personalize at this level not only improves the customer experience but also significantly increases the chances of conversion. In fact, research shows that personalization can deliver 5 to 8 times the return on investment (ROI) and increase sales by 10% or more. By using data to understand what customers want—and delivering it to them in the right way, at the right time—businesses can dramatically improve their sales funnel performance.

    Sales funnels are designed to guide potential customers through a series of steps, from initial awareness to eventual conversion. However, not all customers follow a straight path through the funnel, and many drop off before completing a purchase. Data Analytics can help businesses pinpoint exactly where these bottlenecks occur, enabling them to address issues that are causing friction in the customer journey.

    For instance, imagine an online retailer notices a significant drop-off in conversions between the "Add to Cart" and "Checkout" stages. Using data, the company can analyze a variety of factors to determine the root cause. Are customers abandoning their carts because of high shipping costs, complex checkout processes, or lack of payment options? Data might reveal that a large percentage of customers are leaving after encountering unexpected costs during checkout. Armed with this information, the business can test different strategies—such as offering free shipping thresholds or simplifying the checkout process—to reduce friction and improve conversion rates.

    Data also allows businesses to segment their sales funnel analysis based on different customer profiles. For example, new customers might drop off at different points in the funnel compared to returning customers. This kind of insight can inform targeted strategies that address the specific needs of different customer segments, ensuring that the right solution is applied to the right problem.

    While understanding past customer behavior is essential, predicting future actions can be even more powerful. Predictive analytics, powered by machine learning and data, allows businesses to forecast customer behavior and adjust their strategies proactively. By analyzing historical data and identifying trends, businesses can predict how likely a customer is to convert, what products they might be interested in, and when they are most likely to make a purchase.

    This predictive capability is particularly useful in optimizing sales funnels. For example, a business can use predictive analytics to identify which leads are most likely to convert, enabling sales teams to prioritize their outreach efforts on high-value prospects. This kind of data-driven decision-making allows businesses to be more efficient with their resources, focusing on leads that are most likely to yield results.

    Predictive analytics can also be used to prevent churn. By analyzing customer engagement data, businesses can identify patterns that indicate when a customer is likely to disengage or stop purchasing. Armed with this insight, businesses can take proactive measures to re-engage these customers before they churn, such as offering special promotions, personalized offers, or targeted communications.

    The power of predictive analytics lies in its ability to not just react to customer behavior but anticipate it. By forecasting potential outcomes and acting before problems arise, businesses can maintain a smoother, more optimized sales funnel.

    Today's customer journey is often spread across multiple channels—social media, websites, email, mobile apps, and even in-store visits. Data allows businesses to track and analyze customer interactions across all of these channels, providing a holistic view of the customer journey. This cross-channel insight is crucial for optimizing sales funnels because it ensures that businesses are delivering a consistent and seamless experience, no matter where or how the customer interacts with the brand.

    For example, if a customer begins their journey by clicking on a social media ad, then visits the website to browse products, and later opens an email with a personalized offer, data can track these interactions to create a cohesive experience. Without data integration, these touchpoints might appear disjointed, leading to a fragmented experience that confuses or frustrates the customer.

    By optimizing cross-channel experiences with data, businesses can create a unified, personalized experience that feels seamless to the customer. This reduces friction and keeps the customer engaged, increasing the likelihood of conversion.

    Data has revolutionized the way businesses approach customer journeys and sales funnels. By providing deep insights into customer behavior, enabling personalization, identifying bottlenecks, and forecasting future actions, Data Analytics allows businesses to optimize every stage of the customer journey. In a world where competition is fierce and customer expectations are higher than ever, the ability to use data effectively is no longer optional—it’s essential for success.

    The Shift from Static to Dynamic, Data-Powered Marketing Strategies

    The shift from static to dynamic, data-powered marketing strategies marks a pivotal transformation in how businesses connect with their audiences. In the past, marketing strategies were largely static, relying on broad assumptions about customer needs and behaviors. Campaigns were often designed months in advance, executed on fixed schedules, and reviewed only after their completion. These strategies, while effective in simpler times, lacked the agility to respond to real-time changes in consumer behavior or market conditions. Once a campaign was launched, there was little room to pivot or adjust based on performance. Marketers were essentially flying blind, hoping that their message resonated with the right people at the right time.

    With the explosion of data and advancements in analytics tools, the entire marketing landscape has shifted dramatically. History tells us that marketing strategies are not set in stone. Instead, they are dynamic, fluid, and constantly evolving, driven by real-time data that allows businesses to adapt and respond to consumer behavior as it happens. This shift has transformed marketing from a one-size-fits-all approach to a personalized, data-driven discipline where strategies can be optimized on the fly to achieve maximum impact.

    Data has become the backbone of modern marketing. Every click, every social media like, and every website visit provides valuable insights into consumer preferences and behaviors. These data points, once siloed and inaccessible in traditional marketing, are now captured, analyzed, and applied in real-time to make more informed decisions. This dynamic approach to marketing allows companies to quickly test different strategies, measure their effectiveness, and pivot based on live performance metrics. No longer do marketers need to wait until a campaign ends to assess its success. If something isn’t working, it can be tweaked, modified, or replaced immediately, ensuring that marketing dollars are spent wisely and effectively.

    One of the most significant benefits of this dynamic, data-powered approach is the ability to personalize marketing messages to individual consumers. Companies like Amazon and Netflix have become masters of this by using vast amounts of data to create highly personalized recommendations and content. Amazon’s product suggestions, for example, are not just based on broad categories but on each customer’s individual behavior—what they’ve browsed, what they’ve purchased, and even what similar customers are buying. This level of personalization is possible because of real-time data collection and analysis, allowing businesses to deliver relevant content at precisely the right moment.

    Furthermore, this data-powered flexibility enables brands to respond rapidly to changes in the market. For instance, during significant global events, market disruptions, or shifts in consumer sentiment, companies can adjust their messaging, promotions, and product offerings in real-time. This was particularly evident during the COVID-19 pandemic, when businesses had to quickly adapt their marketing strategies to meet the changing needs of consumers. Those that embraced dynamic, data-driven marketing were able to pivot their messaging, shift to digital channels, and meet their customers where they were—at home and online. Brands that relied on static strategies found themselves struggling to keep up with the rapid changes.

    Another key advantage of this dynamic approach is the ability to optimize campaigns continuously. With access to real-time analytics, marketers can A/B test different versions of ads, landing pages, email subject lines, and more. This experimentation provides immediate feedback on what resonates with consumers, allowing teams to refine their approach and maximize engagement. A dynamic strategy means that marketing is no longer about setting and forgetting—it’s about constant iteration, where small changes are made based on data insights to improve overall performance.

    The dynamic nature of modern marketing also extends beyond just content and messaging; it influences how brands engage with customers across different channels. In a multi-channel world, consumers interact with brands across social media, websites, email, apps, and physical stores, often shifting between these platforms throughout their journey. Data enables businesses to deliver a cohesive experience across all of these touchpoints. For example, a customer might start their journey by clicking on a social media ad, browse products on a website, receive a follow-up email with personalized offers, and finally complete the purchase on a mobile app. A static marketing approach would treat these interactions as separate, unrelated events, but a dynamic, data-powered strategy sees the entire journey as interconnected. The data collected at each stage informs the next interaction, ensuring a seamless experience that feels tailored to the customer.

    Moreover, predictive analytics plays an increasingly critical role in driving dynamic marketing strategies. Instead of reacting to consumer behaviors after they happen, businesses are now using predictive models to anticipate customer needs and preferences before they even arise. These models analyze historical data and current trends to forecast future behaviors, allowing brands to take proactive steps in their marketing efforts. For instance, an online retailer might predict when a customer is likely to make their next purchase based on past behavior and send a personalized offer at just the right time to encourage that purchase. This forward-looking approach adds yet another layer of dynamism to marketing, turning it from a reactive function into a proactive one.

    As businesses continue to collect and analyze more data, this dynamic approach will only become more sophisticated. Artificial intelligence (AI) and machine learning are already enhancing the ability of marketers to make smarter, faster decisions. AI-powered tools can analyze data at a scale and speed far beyond human capabilities, uncovering patterns and insights that were previously invisible. These tools can then suggest optimizations or even autonomously adjust campaigns in real-time, ensuring that marketing strategies are always as effective as possible.

    In addition to enhancing the agility of marketing efforts, dynamic, data-powered strategies also improve efficiency. With real-time insights guiding decision-making, marketers can allocate resources more effectively. They can focus their efforts on campaigns that are performing well and pull back on those that aren’t, all without waiting for end-of-campaign reports. This ability to make data-driven decisions on the fly ensures that marketing budgets are used more wisely, reducing waste and increasing return on investment (ROI).

    Ultimately, the shift from static to dynamic, data-powered marketing strategies reflects the broader digital transformation that businesses are undergoing. As consumers demand more personalized, timely, and relevant experiences, brands must adopt a more agile approach to marketing. Data provides the insights and tools needed to make this shift, turning traditional, one-size-fits-all campaigns into dynamic, tailored strategies that evolve in real-time. Companies that embrace this transformation are not only staying ahead of their competition but also building stronger, more meaningful connections with their customers. In a world where consumer preferences and market conditions can change overnight, the ability to adapt quickly through data-driven marketing is no longer just a competitive advantage—it’s a necessity for survival.

    Integrating Data Insights Across Departments: From Marketing to Product Development

    Data analytics is no longer confined to a single department or used solely for isolated purposes. It’s a cross-functional asset that can drive smarter decision-making across an entire organization. Gone are the days when marketing operated in a silo, using data only for campaign performance, while product development relied solely on customer feedback or sales teams worked independently with their own metrics. The modern organization thrives on the integration of data insights across all departments—each one feeding off the other to create a more cohesive, efficient, and impactful business strategy.

    The integration of data from marketing, sales, product development, and beyond allows businesses to make more informed decisions, streamline workflows, and foster greater collaboration across teams. This interconnected approach provides a full view of customer behavior, market trends, and operational efficiency, allowing each department to make data-driven decisions that align with the overall business objectives. The result is a unified company vision where marketing drives customer demand, product teams innovate based on real-time feedback, and sales teams close deals with more precise targeting.

    Let’s explore how data integration across departments transforms a business, from marketing to product development and everywhere in between.

    Data has long been the backbone of effective marketing strategies, but in recent years, its reach has expanded well beyond the marketing department. In a data-driven organization, marketing no longer operates in isolation. Instead, it serves as a critical source of customer insights that inform product development, sales tactics, and customer service strategies. Marketing teams collect vast amounts of data about customer preferences, behaviors, and responses to campaigns. When this data is shared across departments, the entire organization benefits.

    For instance, marketing’s ability to segment customers based on detailed behavioral data allows the sales team to target leads more effectively. With insights into which types of content or product features resonate with certain customer segments, sales teams can tailor their pitches to specific prospects, increasing the likelihood of closing a deal. Instead of taking a one-size-fits-all approach, they can present a solution that directly addresses the customer’s needs, as demonstrated by the marketing data.

    This cross-departmental flow of information isn’t limited to just sales. Product development teams also stand to gain significantly from marketing insights. Traditionally, product development relied on customer surveys, direct feedback, or focus groups to understand what features or improvements were needed. While these methods still have their place, they offer a limited view of customer needs. Marketing data provides a much broader perspective, offering real-time insights into what customers are saying, what features are most talked about, and how they’re engaging with the product.

    For example, if marketing data shows that a particular feature of a product is generating a high level of engagement on social media or driving significant web traffic, the product development team can take that as a cue to prioritize similar features in upcoming releases. Conversely, if marketing campaigns focused on a certain product feature are falling flat, that data can signal to the product team that the feature may not be as valuable to customers as originally thought. This kind of integration ensures that product teams are not working in a vacuum but are continually informed by real customer behavior, allowing them to innovate more effectively.

    One of the greatest benefits of integrating data across departments is the alignment it creates between marketing and product development. When these two departments work closely together, backed by shared data, the gap between what customers want and what the company offers shrinks significantly. Marketing can relay customer desires and pain points directly to product development, which can then tailor their efforts to meet those needs. This eliminates the guesswork that often plagues product design and innovation, leading to more relevant and successful product offerings.

    Consider the case of a company launching a new app feature. Marketing might run an initial campaign to gauge interest in the feature, gathering data on user interactions and engagement. Meanwhile, product development can monitor this data to assess the feature's success in real time. If the data shows high engagement, the development team can accelerate further enhancements or complementary features. If the response is lukewarm, the team can pivot quickly, either improving the feature or shifting focus to something more aligned with user preferences. This real-time feedback loop, driven by data, ensures that companies are more responsive to their market and can make adjustments on the fly rather than after months of post-launch analysis.

    Furthermore, integrating data across departments helps bridge the gap between customer experience and product development. Marketing often serves as the first point of contact between the customer and the brand, capturing valuable data about customer expectations. By feeding this data directly into product development, businesses can create products that more closely align with customer needs right from the start, reducing the risk of developing features that miss the mark.

    One company that excels at integrating data across departments is Spotify. As a company that thrives on user engagement and data, Spotify constantly collects information on what users listen to, how they discover music, and which playlists they create. This data flows freely between marketing, product development, and even content creation. For instance, marketing teams use the data to understand which types of playlists drive the most engagement, while the product team can use the same data to improve Spotify's recommendation algorithms. Even content teams benefit from this integration, as they can see which genres, artists, or types of playlists resonate most with users, allowing them to tailor their editorial content accordingly.

    Another area where data integration can have a profound impact is customer service. When marketing, sales, and customer service share data seamlessly, it creates a more unified and personalized experience for the customer. For instance, if a customer reaches out to support with a product issue, customer service can reference their purchase history, marketing interactions, and even which sales representative handled the account. This allows the support team to offer more tailored solutions, resulting in quicker problem resolution and greater customer satisfaction. Customer service can also pass data back to marketing and product development, identifying recurring issues that may signal a need for product improvement or better customer education.

    This integrated approach enables businesses to close the loop on customer feedback more effectively. Marketing and product development are no longer separate entities working with incomplete information. Instead, they become part of a connected ecosystem where data flows freely, ensuring that every customer touchpoint is optimized for engagement, satisfaction, and growth.

    Even leadership teams benefit from integrating data across departments. When executives have access to unified data dashboards that pull insights from marketing, product development, sales, and customer service, they can make more informed strategic decisions. These insights provide a holistic view of the business, allowing leaders to see how each department’s efforts contribute to overall performance. This level of visibility fosters a more collaborative environment, where all teams are working toward the same data-driven goals.

    In addition to enhancing collaboration, integrating data across departments also drives innovation. When marketing and product development teams are working from the same data set, they can identify emerging trends and opportunities that may not have been apparent from a single department's perspective. For instance, marketing data might show a spike in customer interest in sustainability, prompting product teams to prioritize eco-friendly features or materials in upcoming releases. This kind of forward-thinking innovation is only possible when departments are aligned and working with shared insights.

    Ultimately, the integration of data across departments transforms businesses from fragmented operations into cohesive, data-driven ecosystems. By sharing data between marketing, sales, product development, customer service, and beyond, companies can make smarter decisions, innovate more effectively, and deliver more personalized experiences to their customers. This level of integration not only improves internal collaboration but also positions companies to respond more quickly and efficiently to market changes, customer feedback, and emerging trends.

    Data is one of the most valuable assets a company can have, integrating those insights across departments is essential for driving growth, improving customer satisfaction, and fostering innovation. Organizations that embrace this cross-functional data integration will be better equipped to thrive in an increasingly competitive, data-driven marketplace.

    Introduction to Sales and Marketing Analytics: Theories & Cases

    📘 Ready to Transform Your Sales and Marketing Strategies?

    Dive deeper into the power of data-driven decision-making and unlock actionable insights to stay ahead in today's competitive market.

    Order your copy of Introduction to Sales and Marketing Analytics: Theories & Cases now on Amazon: Click here to buy 🚀

    Don't just keep up—lead the way!

    #DataAnalytics #Marketing #Sales #Leadership #BusinessGrowth

  • The Role of Predictive Analytics in Sales Forecasting

    The Role of Predictive Analytics in Sales Forecasting

    Sales forecasting plays a central role in business strategy, impacting everything from inventory planning to budget allocation. Inaccurate forecasts can lead to significant losses, with overstocking, missed sales opportunities, and poorly managed resources all affecting a company’s bottom line. As customer behavior becomes more unpredictable and markets evolve at unprecedented rates, businesses are increasingly turning to predictive analytics to gain a competitive edge in their forecasting efforts.

    Accurate sales forecasting is essential for success, influencing key areas like inventory management, resource allocation, and strategic planning. Traditional forecasting methods, while foundational, often struggle to adapt to the complexities of modern consumer

    behavior and fast-changing market conditions. As described in Sales and Marketing Analytics, the move from intuition-based decisions to data-driven strategies has transformed how businesses operate, providing deeper insights that enable more precise forecasting and customer engagement (Magrini, 2024).

    Predictive analytics, a core element of data-driven decision-making, leverages historical data and advanced modeling techniques to generate forward-looking insights. This approach allows businesses to predict demand patterns, adapt to seasonal changes, and respond quickly to emerging market trends. Techniques such as time series analysis, regression, and machine learning have proven valuable across industries, from retail to manufacturing, where they improve demand planning, sales strategy, and customer satisfaction.

    However, the shift to predictive analytics introduces challenges, including the need for high-quality data, integration across platforms, and managing algorithmic bias. Moreover, as Sales and Marketing Analytics emphasizes, balancing model complexity with interpretability remains crucial for making actionable insights accessible to all stakeholders (Magrini, 2024).

    This article reviews key methodologies and applications of predictive analytics in sales forecasting, presenting case studies across various sectors and addressing both the challenges and potential for future developments. In doing so, it highlights how predictive analytics continues to redefine sales forecasting, fostering data-informed decisions and agile business strategies.

    Overview of Predictive Analytics in Sales Forecasting

    Predictive analytics is reshaping the field of sales forecasting by allowing companies to anticipate demand, optimize operations, and adapt to market changes with unprecedented accuracy. Unlike traditional forecasting methods, which often rely on historical averages and expert judgment, predictive analytics integrates large datasets, advanced algorithms, and machine learning models to provide insights into future sales trends. This approach enables companies to make more data-informed decisions that enhance efficiency and reduce risk.

    Time series analysis, regression models, and machine learning algorithms are central techniques in predictive analytics for sales forecasting. Time series analysis is widely used to detect seasonal trends, cyclical patterns, and shifts in demand over time, making it invaluable for industries where sales fluctuate seasonally (Makridakis et al., 2018). Meanwhile, regression models provide linear or nonlinear relationships between sales and key variables, allowing businesses to see how changes in factors like price or marketing spend impact demand. Machine learning algorithms, particularly neural networks and decision trees, bring added flexibility by learning from new data and adjusting forecasts in real time, a feature especially relevant in fast-paced markets (Hyndman & Athanasopoulos, 2018).

    In addition to predicting sales volume, predictive analytics can provide a customer-centric perspective on forecasting by incorporating customer data, such as purchase history and behavior, to identify patterns that indicate future buying intentions. Research shows that companies using customer-centric predictive models see increased customer retention and loyalty, as they can anticipate and meet customer needs proactively (Chong et al., 2017). For example, a company can analyze purchasing behavior to identify high-value customers likely to make repeat purchases, enabling more precise targeting and tailored promotions.

    The applications of predictive analytics in sales forecasting extend beyond predicting demand. Companies also use these insights to manage inventory, production schedules, and workforce planning. Retailers can use predictive models to stock high-demand items ahead of peak seasons, reducing both stockouts and excess inventory (Shmueli & Koppius, 2011). Similarly, manufacturers can streamline production processes based on anticipated demand, optimizing costs and minimizing waste (Saghiri et al., 2017). In turn, these operational efficiencies contribute to a more agile business model that can respond quickly to changing market conditions.

    Despite the transformative potential of predictive analytics, challenges remain. High-quality, consistent data is essential for accurate predictions, and issues with data integration across departments can hinder the effectiveness of models (Chen et al., 2020). Furthermore, while complex models like neural networks offer higher accuracy, they are often harder for stakeholders to interpret, raising questions about the balance between precision and usability (Rai, 2020). Algorithmic bias is another concern, as biased data or model design can lead to skewed predictions, with serious implications for decision-making (Obermeyer et al., 2019).

    In summary, predictive analytics is a game-changer in sales forecasting, equipping companies with the tools to anticipate market trends, optimize resources, and drive better strategic decisions. As data availability and algorithm sophistication continue to grow, predictive analytics will likely play an even more prominent role in shaping the future of business forecasting.

    Core Predictive Analytics Techniques in Sales Forecasting

    Predictive analytics in sales forecasting relieve a variety of techniques, each with distinct strengths for analyzing patterns, detecting trends, and making accurate predictions about future demand. Key methods include time series analysis, regression models, and machine learning algorithms, all of which contribute unique capabilities to the forecasting process.

    1.Time Series Analysis Time series analysis is one of the most common methods in sales forecasting, particularly for businesses with highly seasonal or cyclical demand patterns. By analyzing data points collected over time, such as monthly or quarterly sales, time series methods reveal trends, seasonal variations, and long-term shifts in demand.

    Techniques such as Autoregressive Integrated Moving Average (ARIMA) models have been widely used due to their effectiveness in capturing these patterns (Box et al., 2015). Additionally, the exponential smoothing method, including the Holt-Winters seasonal model, is useful for businesses requiring seasonally adjusted forecasts (Hyndman & Athanasopoulos, 2018). These models work particularly well in stable, predictable environments, although they may require enhancements, like machine learning, in more dynamic markets.

    2.Regression Models Regression models are used to determine the relationship between sales and various independent variables, such as marketing spend, price changes, or economic indicators. Linear regression is commonly applied in scenarios where a straightforward relationship exists between variables, while more complex regression techniques, such as logistic regression and polynomial regression, are used for nonlinear relationships. These models provide insights into which factors most significantly influence sales, allowing companies to adjust their strategies based on projected outcomes. Research has shown that regression analysis is particularly effective in optimizing marketing campaigns and adjusting pricing strategies to align with forecasted demand (Chong et al., 2017).

    3.Machine Learning Algorithms Machine learning brings a high degree of adaptability and accuracy to sales forecasting, making it well-suited for complex and fast-changing environments. Algorithms such as decision trees, random forests, and neural networks are used to analyze extensive datasets and uncover intricate patterns. Neural networks, in particular, are effective in handling large and nonlinear datasets and can adjust forecasts dynamically as new data becomes available. This makes them highly valuable for businesses dealing with rapid shifts in consumer behavior or market volatility (Goodfellow et al., 2016). Decision trees, on the other hand, allow for greater model interpretability and are often used for tasks like demand classification and customer segmentation.

    4.Data Integration and Real-Time Analytics For predictive models to function optimally, data integration across departments—such as marketing, finance, and operations—is essential. Integrating data enables the collection of comprehensive insights that refine the forecasting model’s accuracy. Real-time analytics, which continuously feeds new data into models, allows companies to adjust forecasts in response to emerging trends. In industries like retail and e-commerce, real-time data integration helps track changes in customer demand almost instantly, enabling agile adjustments to stock levels, pricing, and marketing strategies (Chen et al., 2020). With the growth of cloudtechnology and IoT, businesses now have access to vast amounts of real-time data, making these rapid adjustments increasingly feasible.

    5.Combining Techniques for Enhanced Forecasting Many companies use a combination of these techniques to enhance forecasting accuracy. Hybrid models that blend traditional statistical methods with machine learning techniques are becoming more common, as they balance the interpretability of simpler models with the precision of machine learning. For instance, some organizations start with time series or regression analysis to establish baseline forecasts, then refine them using machine learning to adapt to short-term fluctuations. This hybrid approach allows for a more robust forecast that adjusts dynamically to both historical trends and real-time shifts in demand.

    Predictive analytics techniques in sales forecasting empower businesses to make more informed, proactive decisions, but they require careful implementation and maintenance. Selecting the appropriate method or combination of methods is key to developing a model that is both accurate and actionable, aligning with the company’s unique data, market conditions, and forecasting goals. As technology advances, these techniques will continue to evolve, driving further improvements in the precision and usability of sales forecasts.

    Challenges of implementing AI in sales

    Predictive analytics in sales forecasting has a broad range of applications across industries, each leveraging data-driven insights to improve operational efficiency, customer satisfaction, and profitability. From retail and manufacturing to B2B sales and e-commerce, companies are using predictive analytics to drive targeted strategies, optimize inventory, and adapt to customer demand.

    1.Retail Industry In the retail sector, predictive analytics enables companies to anticipate consumer demand, tailor marketing efforts, and ensure optimal stock levels during peak seasons. For instance, Walmart uses predictive analytics to forecast demand and manage inventory across its extensive store network. By analyzing historical sales data and real-time purchasing patterns, Walmart can adjust its stock levels dynamically, reducing the risk of stock outs and overstock. Predictive analytics also support targeted promotions by identifying when specific customer segments are most likely to respond to discounts or new launches, significantly enhancing marketing ROI (Marr, 2017).

    2.Manufacturing Sector Predictive analytics is essential in manufacturing for aligning production schedules with anticipated demand. Companies such as Siemens use predictive models to anticipate demand shifts and plan their production cycles, accordingly, thereby minimizing waste and optimizing resource allocation. In the automotive industry, Toyota has implemented predictive maintenance through data analytics, enabling it to anticipate machinery failures before they occur. This approach not only helps Toyota manage its production timelines more effectively but also minimizes downtime and reduces operational costs (Lee et al., 2014).

    3.B2B Sales For B2B companies, predictive analytics often focuses on lead scoring and sales funnel optimization. Using customer data, companies can predict which leads are most likely to convert, allowing sales teams to focus their efforts on high-value prospects. Salesforce, a leader in customer relationship management, has integrated predictive analytics into its platform to help clients anticipate customer needs, track potential sales, and improve customer engagement. By analyzing engagement data, Salesforce can assist B2B companies in identifying high-value clients and suggesting the most effective engagement strategies (Davenport & Ronanki, 2018). Predictive lead scoring enables B2B sales teams to increase conversion rates by aligning outreach efforts with the needs and behaviors of targeted clients.

    4.E-commerce In e-commerce, predictive analytics is used to personalize the customer journey, optimize product recommendations, and manage stock based on demand forecasts. Amazon’s recommendation engine, which is powered by predictive analytics, suggests products based on a customer’s browsing and purchasing history, improving the likelihood of additional purchases. Amazon also uses predictive analytics for dynamic pricing, adjusting prices in real time based on demand trends, competitor pricing, and product availability. This approach maximizes revenue potential by adapting pricing to market conditions (Agrawal et al., 2018). Furthermore, predictive analytics helps e-commerce companies anticipate trends during seasonal peaks, ensuring timely stock replenishment and enhancing the customer experience.

    5.Healthcare and Pharmaceuticals Predictive analytics is also valuable in healthcare, particularly in pharmaceutical sales and supply chain management. By analyzing prescription data, demographic information, and seasonal trends, pharmaceutical companies can predict the demand for medications. This is particularly important in scenarios where the demand for certain medications, such as flu vaccines, fluctuates based on seasonal and demographic factors. Predictive models allow pharmaceutical companies to anticipate spikes in demand and ensure an uninterrupted supply chain, preventing shortages that could affect patient care (Topol, 2019). Additionally, healthcare providers use predictive analytics to optimize patient outreach, identifying which patients are most likely to benefit from preventive care or follow-up consultations.

    Summary of Industry Applications

    Across various sectors, predictive analytics is transforming sales forecasting into a proactive, precision-driven practice that drives better business decisions. By tailoring forecasts to specific industries’ needs, companies can manage inventory, anticipate customer preferences, and align production with market demand. Each of these case studies illustrates the diverse ways predictive analytics is applied, showcasing the flexibility and impact of data-driven forecasting across sectors.

    These real-world applications highlight predictive analytics’ role in improving efficiency, enhancing customer satisfaction, and providing a competitive edge. As predictive models and technology continue to advance, their application in sales forecasting will only broaden, further integrating into critical business functions and strategic planning.

    Challenges in Implementing Predictive Analytics for Sales Forecasting

    While predictive analytics holds significant promise for improving sales forecasting accuracy, its implementation is complex and can be hampered by several challenges. These include issues with data quality, the balance between model interpretability and accuracy, and, notably, the management of both data abundance and data scarcity, which can influence model effectiveness.

    1. Data Quality and Integration Predictive models are only as good as the data they use. High-quality, clean, and consistent data is essential for accurate predictions, yet data is often spread across disparate systems or inconsistently formatted. Many companies face the challenge of integrating data from various sources, including CRM systems, sales records, and third-party data providers. Inconsistencies can lead to flawed predictions, which may ultimately misinform business decisions. Implementing standardized data governance practices and integrating systems can mitigate these issues, as noted by Chen et al. (2020).

    2. Abundance of Data While access to abundant data can be advantageous, it also brings unique challenges. With large amounts of data, businesses face difficulties in managing, cleaning, and processing information in a way that keeps predictive models accurate. An excess of data points, particularly if they come from varied sources such as social media, transaction records, and customer feedback, can also introduce noise, potentially skewing the model’s accuracy if not properly managed. Techniques like data filtering and feature selection are crucial in ensuring that predictive models focus on relevant variables, as excess information can sometimes lead to overfitting, where the model becomes too complex and performs poorly on new data (Shmueli & Koppius, 2011).

    3. Scarcity of Data On the opposite end of the spectrum, some businesses may struggle with limited data, particularly new or niche companies without a long sales history or small businesses operating in markets with low transaction volumes. Data scarcity can restrict the effectiveness of machine learning models, which generally rely on large datasets to identify reliable patterns. To address this, businesses can implement techniques such as data augmentation, which uses synthetic data to expand training datasets, or leverage external datasets to supplement limited internal data. In smaller datasets, simpler statistical models like linear regression or ARIMA can sometimes outperform complex machine learning models due to their ability to make inferences from limited inputs (Hyndman & Athanasopoulos, 2018).

    4. Algorithmic Bias and Model Fairness Bias in data can lead to biased predictions, potentially causing companies to

    overlook certain market segments or overemphasize others. For example, a model trained primarily on urban customer data may inaccurately forecast demand in rural areas. To counteract these issues, businesses must periodically test their models for bias and utilize diverse datasets that better represent the full customer base. Obermeyer et al. (2019) emphasizes the importance of fairness in model development, as biases can significantly impact the accuracy and ethical integrity of predictions.

    5. Balancing Accuracy with Interpretability Advanced machine learning models, such as deep learning, offer high accuracy but often at the expense of interpretability. While these models can handle data-rich environments effectively, their “black box” nature makes it difficult for non-technical stakeholders to understand or trust predictions. In cases where interpretability is critical, simpler models like decision trees or regression analysis may be preferred, even if they sacrifice some accuracy (Rai, 2020).

    6. Scalability and Maintenance As predictive models are deployed; they need ongoing maintenance and scaling to remain accurate and relevant. For example, models trained on data collected over a specific period may become outdated as consumer behavior or market conditions shift. Moreover, scaling models to accommodate increased data or new markets requires robust infrastructure and resources, which can be particularly challenging for smaller organizations. Saghiri et al. (2017) suggest that scalable, flexible models are crucial for long-term predictive analytics success.

    7. Cost of Implementation Implementing predictive analytics can be resource-intensive, requiring skilled personnel, robust software, and sometimes costly infrastructure. Small and medium-sized enterprises (SMEs) may face financial barriers to adopting these tools. However, with the rise of cloud-based analytics platforms, many organizations can leverage scalable, cost-effective solutions without significant infrastructure investment (Agrawal et al., 2018).

    8. Data Privacy and Security Predictive models often rely on customer data, making privacy and security essential. Adherence to privacy regulations like the GDPR and secure handling practices help protect sensitive information. Companies should also implement access controls and encryption measures to minimize data risks (Topol, 2019).

    Summary of Challenges

    The implementation of predictive analytics in sales forecasting is shaped by both data abundance and data scarcity. For data-rich companies, effective management and filtering practices are necessary to prevent model overfitting and to ensure focus on relevant information. For data-scarce organizations, leveraging external datasets, data augmentation, or simpler statistical models can improve forecast accuracy. As companies work to overcome these and other challenges, including integration, bias mitigation, and privacy concerns, predictive analytics can serve as a powerful tool for data-informed, accurate, and actionable sales forecasts.

    Future Trends and Opportunities in Predictive Analytics for Sales Forecasting

    Predictive analytics in sales forecasting poised for transformative advancements, driven by rapid developments in artificial intelligence (AI), real-time data integration, explainable AI, and the emphasis on data privacy and ethics. These shifts are set to bring enhanced accuracy, agility, and strategic depth to businesses across industries, helping them adapt more proactively to evolving markets and customer expectations.

    As predictive analytics tools become increasingly sophisticated, the integration of AI will be pivotal. AI’s capacity to analyze massive datasets with complex interdependencies allows for more accurate, adaptive models. Machine learning and deep learning, in particular, can detect nuanced patterns in historical and real-time data, providing organizations with forecasts that adapt to changing behaviors. According to Sales and Marketing Analytics, AI-based systems like natural language processing (NLP) are now capable of parsing customer sentiment from sources like social media and online reviews, giving businesses unprecedented insight into shifting consumer preferences (Magrini, 2024). By capturing real-time customer opinions and attitudes, NLP can help businesses detect emerging trends before they fully manifest, allowing companies to align sales forecasts with market demands faster and more precisely.

    Real-time data analytics is another area primed for significant growth, thanks to advances in Internet of Things (IoT) devices, 5G connectivity, and cloud infrastructure. Real-time data transforms sales forecasting by enabling companies to adjust quickly to emerging patterns in customer behavior, supply chain disruptions, and competitive pricing. For example, a retailer could monitor daily foot traffic and adjust in-store promotions to align with peak shopping times. With the data democratization described in Sales and Marketing Analytics, companies can ensure that insights are accessible to various departments—marketing, sales, and supply chain teams can coordinate in real time, creating a more unified response to demand shifts (Magrini, 2024). This agility gives businesses a distinct advantage in dynamic markets where responsiveness can directly impact revenue and customer satisfaction.

    Alongside these technological advances, explainable AI (XAI) emerge as a crucial tool for bridging the gap between sophisticated predictive models and business usability. As AI models become more complex, interpretability can suffer, leaving non-technical stakeholders uncertain about how predictions are generated. Sales and Marketing Analytics emphasizes the growing need for transparent, interpretable models that allow decision-makers to trust and act confidently on insights generated by AI (Magrini, 2024). Explainable AI techniques such as visual explanations, feature importance rankings, and user-friendly dashboards enable managers and executives to understand not only what the predictions are but why they make sense, enhancing the integration of predictive analytics into everyday business decisions.

    As predictive analytics becomes a core aspect of business operations, ethical considerations and data privacy will be increasingly prioritized. With growing reliance on customer data to power predictions, regulatory frameworks like the General Data Protection Regulation (GDPR) require businesses to implement strict data handling and privacy standards. The focus on data privacy discussed in Sales and Marketing Analytics aligns with a shift towards responsible AI—companies are adopting privacy-preserving techniques such as data anonymization and differential privacy to protect customer information while maintaining the predictive power of their models (Magrini, 2024). Addressing these privacy concerns not only fosters consumer trust but also protects organizations from potential legal repercussions and reputational damage.

    Looking forward, these trends indicate future where predictive analytics in sales forecasting will be not only more accurate and adaptive but also more transparent and ethically responsible. As businesses integrate AI, real-time data, and explainable AI into their predictive processes, they will be able to navigate complex, competitive markets with greater agility and foresight. In doing so, predictive analytics will evolve into an even more essential strategic tool, enabling organizations to stay ahead of the curve and proactively shape their markets, all while upholding the ethical standards demanded by today’s data-conscious consumers.

    So, whats next?

    The role of predictive analytics in sales forecasting has become increasingly integral to modern business strategies, enabling organizations to move beyond reactive approaches toward proactive, data-driven decision-making. This comprehensive review of predictive analytics in sales forecasting reveals critical insights about its effectiveness, challenges, and evolving applications across industries. Here, we delve into the comparative effectiveness of various predictive methodologies, industry-specific applications, practical and technical challenges, ethical concerns, and emerging trends in the field.

    Comparative Effectiveness of Predictive Models

    Different predictive analytics methods offer unique advantages and limitations, each suited to specific forecasting needs. Time series analysis, regression models, and machine learning algorithms, such as neural networks and decision trees, have distinct strengths that make them useful in varied scenarios. Time series models like ARIMA are particularly effective in capturing seasonal trends and cyclical patterns, making them ideal for industries with stable, predictable demand, such as traditional retail. However, these models may fall short in dynamic or highly volatile environments. In contrast, machine learning models such as neural networks and ensemble methods excel in processing large datasets and identifying complex patterns that traditional models cannot capture, making them valuable in fast-changing sectors like e-commerce and technology.

    The adaptability of machine learning models is evident in their ability to “learn” from new data and adjust their predictions accordingly. Decision trees, for instance, provide transparency and allow non-technical stakeholders to understand the decision-making

    process, making them particularly useful in organizations where interpretability is crucial. Neural networks, though often viewed as “black boxes,” are highly accurate in scenarios involving large, nonlinear datasets. This trade-off between accuracy and interpretability is central to the choice of predictive model, as businesses must weigh the value of precise predictions against the need for transparent insights that can be communicated across departments.

    Moreover, hybrid models, which combine traditional statistical methods with machine learning, are gaining traction in sales forecasting. These models allow organizations to leverage the simplicity and interpretability of time series or regression models alongside the predictive power of machine learning algorithms. For instance, a company might use a time series model to establish baseline trends and then apply machine learning to adjust forecasts based on recent shifts in consumer behavior or external economic factors. This blend of methods can help businesses manage the complexity of forecasting in dynamic environments, where both long-term patterns and short-term adjustments are essential.

    Industry-Specific Applications and Impact

    Predictive analytics’ applications vary widely across industries, each with unique requirements and outcomes. In the retail sector, predictive models are used to optimize inventory management, plan seasonal promotions, and set dynamic pricing strategies. By analyzing historical sales data and real-time purchasing trends, retailers can anticipate demand fluctuations more accurately, minimizing stockouts during peak seasons and reducing excess inventory. For instance, major retailers use predictive analytics to align their stock levels with anticipated demand, leveraging historical data to prepare for holiday seasons, back-to-school periods, and other high-traffic times. This strategic alignment improves customer satisfaction by ensuring product availability, while also reducing inventory holding costs and waste.

    In manufacturing, predictive analytics contributes to more efficient production planning and supply chain management. By forecasting demand accurately, manufacturers can synchronize their production schedules with anticipated market needs, avoiding the inefficiencies of overproduction or underproduction. Predictive models in manufacturing also support preventive maintenance; by analyzing equipment performance data, companies can anticipate and mitigate potential breakdowns, reducing downtime and associated costs. Automotive manufacturers, for example, leverage predictive analytics to manage production and anticipate part requirements, ensuring that assembly lines operate smoothly and customer demand is met without costly delays.

    The B2B sector, which often deals with longer sales cycles and higher-value transactions, uses predictive analytics to prioritize leads and streamline the sales pipeline. Lead scoring models powered by machine learning help sales teams identify high-potential clients, enabling more efficient allocation of resources and increasing conversion rates. In technology and pharmaceutical sales, where client acquisition costs are high, predictive analytics helps refine lead qualification processes, thereby optimizing the sales funnel and driving revenue. Additionally, customer lifetime value (CLV) models provide insights into long-term client profitability, helping B2B companies make strategic decisions about client retention efforts.

    In e-commerce, predictive analytics enhances the customer experience by powering recommendation engines, dynamic pricing, and personalized marketing campaigns. E-commerce giants like Amazon employ predictive algorithms to recommend products, dynamically adjust prices based on competitor actions, and optimize marketing messages based on individual customer preferences. This data-driven personalization not only increases customer engagement but also improves conversion rates, ultimately contributing to higher revenues and customer loyalty. Predictive analytics enables e-commerce platforms to react to changing consumer trends in real time, providing a competitive edge in a crowded digital marketplace.

    Practical and Technical Challenges

    Despite the advantages of predictive analytics, its implementation in sales forecasting poses several technical and operational challenges. Data quality remains a primary obstacle, as predictive models require clean, structured, and consistent data to function accurately. In many organizations, data is fragmented across various departments and platforms, making it challenging to integrate and standardize. Data inconsistency can introduce errors into predictive models, reducing forecast accuracy and reliability. Ensuring high data quality often requires significant investment in data cleaning, integration, and governance practices, which can be resource-intensive but necessary for robust analytics.

    Algorithmic bias is another concern that affects the validity of predictive analytics. Models trained on biased datasets risk perpetuating these biases, potentially leading to skewed predictions. For example, a sales forecasting model trained predominantly on data from urban areas may inaccurately predict demand in rural markets. Addressing algorithmic bias requires careful data selection, regular model evaluations, and the inclusion of diverse data sources to create fair and balanced predictions. Organizations that recognize and actively mitigate bias are better positioned to leverage predictive analytics responsibly and inclusively.

    The trade-off between model interpretability and accuracy is a recurring challenge, particularly with complex machine learning models such as neural networks. High accuracy in forecasting is often achieved at the expense of transparency, making it difficult for non-technical stakeholders to understand the reasoning behind predictions. Explainable AI (XAI) is emerging as a solution to this issue, providing methods for interpreting complex models and making their outputs accessible to broader audiences. Techniques such as feature importance rankings, decision visualization, and model-agnostic explanations are helping bridge the gap between sophisticated analytics and business usability, enhancing stakeholder trust and facilitating data-driven decision-making.

    Scalability and maintenance are additional considerations, especially for businesses that aim to deploy predictive models across multiple regions or business units. Predictive

    models require continuous updates and maintenance to remain relevant in the face of shifting market conditions and evolving consumer preferences. As organizations grow or expand into new markets, predictive models must adapt to accommodate larger datasets and more complex variables. Building scalable models that can evolve alongside organizational growth is critical to sustaining the value of predictive analytics over time.

    Ethical Considerations and Data Privacy

    The reliance on customer data in predictive analytics raises important ethical and privacy concerns. Predictive models often depend on sensitive information such as purchase history, demographics, and behavioral data to generate insights, necessitating stringent data protection measures. Regulatory frameworks like the General Data Protection Regulation (GDPR) mandate responsible data handling practices, including data minimization, anonymization, and the right to data portability. Organizations that prioritize ethical data usage not only comply with legal requirements but also build trust with consumers, a critical asset in today’s data-conscious market environment.

    The ethical use of data also intersects with issues of transparency and fairness. Consumers are increasingly aware of and sensitive to how their data is used, and businesses must ensure that predictive models do not inadvertently discriminate or marginalize certain groups. This requires companies to develop ethical guidelines for data usage and to implement model evaluation practices that detect and correct for potential biases. Ethical AI practices, including fairness assessments and privacy-preserving techniques, are becoming essential components of responsible predictive analytics strategies.

    Emerging Trends and Future Directions

    Looking ahead, advancements in artificial intelligence, real-time data integration, and explainable AI are set to elevate the role of predictive analytics in sales forecasting. AI-driven models, such as reinforcement learning and deep learning, enable more adaptive forecasting methods that can continuously refine predictions based on new data inputs. Real-time data, made increasingly accessible by IoT devices and cloud infrastructure, allows organizations to make immediate adjustments in response to shifts in customer behavior or market conditions. For instance, a retailer equipped with real-time data insights can respond to unexpected demand surges, optimizing stock levels and adjusting promotional efforts dynamically.

    Explainable AI is emerging as a solution to the challenge of interpretability, making complex machine learning models more transparent and understandable. As XAI techniques improve, organizations will be better equipped to leverage advanced models without sacrificing interpretability, enabling cross-functional teams to make data-driven decisions confidently. Future developments in XAI are likely to enhance the accessibility of predictive analytics, empowering a broader range of stakeholders to engage with and act upon predictive insights.

    In addition, privacy-preserving methods such as differential privacy and federated learning are becoming increasingly important as companies seek to balance the demand for data-driven insights with the need to protect consumer data. These techniques allow businesses to extract valuable insights from data while minimizing risks to individual privacy, ensuring compliance with regulatory standards and fostering consumer trust.

    Predictive analytics has become an indispensable component of modern sales forecasting, fundamentally shifting how businesses approach demand planning, resource allocation, and strategic decision-making. By enabling organizations to harness large volumes of data, predictive analytics provide insights that go beyond traditional, intuition-based methods, offering an evidence-based approach to anticipate customer demand, identify emerging trends, and optimize business operations.

    Summary of Findings

    Our exploration of predictive analytics techniques reveals a spectrum of methodologies, each offering unique advantages suited to different forecasting needs. Traditional statistical methods, such as time series analysis and regression models, continue to be valuable, especially in stable environments where patterns in historical data are consistent and predictable. These methods provide a solid foundation, leveraging known trends to guide decision-making with relatively straightforward models. However, as consumer behavior and market conditions become more dynamic, machine learning algorithms like neural networks, decision trees, and ensemble methods bring a level of adaptability that traditional models often lack. These advanced models process larger datasets, recognize complex patterns, and adjust in real time, making them particularly effective in fast-paced industries such as e-commerce and technology.

    The applicability of predictive analytics extends across diverse industries, with specific benefits tailored to each sector. In retail, predictive models allow for precise inventory management, minimizing the risk of stockouts during peak seasons and reducing excess inventory costs. In manufacturing, analytics-driven demand forecasting enables synchronized production schedules, which reduce both overproduction and costly downtime. Meanwhile, B2B companies use lead scoring and customer lifetime value analysis to streamline their sales pipelines and optimize client acquisition strategies. These industry-specific applications illustrate predictive analytics’ versatility and highlight its potential to deliver both operational efficiency and enhanced customer satisfaction.

    Challenges and Considerations

    Despite its transformative potential, implementing predictive analytics is not without significant challenges. Data quality and integration issues frequently arise, as predictive models rely heavily on clean, structured, and comprehensive datasets to provide accurate forecasts. Data inconsistencies across departments, platforms, or sources can compromise model reliability, leading to erroneous forecasts that could impact decision-making.

    Addressing these issues requires rigorous data governance policies, data cleansing practices, and a commitment to integrating data from multiple systems in a standardized format. This task can be resource-intensive but is essential for ensuring the accuracy and effectiveness of predictive models.

    Another challenge is the presence of algorithmic bias, which can arise from historical data that reflects inequities or imbalances within a market. When trained on biased data, predictive models may perpetuate these biases, skewing predictions in ways that could disadvantage certain customer segments or lead to inaccurate forecasts. As predictive analytics become increasingly integral to business operations, addressing algorithmic bias is crucial for maintaining model fairness and reliability. Techniques such as bias testing, regular model evaluation, and the inclusion of diverse datasets can help mitigate bias, although these practices require ongoing attention to ensure that models remain equitable and inclusive.

    Interpretability is another key consideration; especially as complex machine learning models are more commonly used. Advanced models like neural networks, while highly accurate, often function as “black boxes,” making it challenging for stakeholders to understand the rationale behind their predictions. This lack of transparency can be a barrier to adopting predictive analytics, as decision-makers may hesitate to act on predictions they do not fully understand. Explainable AI (XAI) emerges as a solution, providing methods that enhance model interpretability through techniques such as feature importance scoring and visualization tools. XAI enables stakeholders to grasp the logic of predictive models, fostering greater trust and confidence in the forecasts generated.

    Future Trends and Opportunities

    The future of predictive analytics in sales forecasting is shaped by rapid advancements in artificial intelligence, real-time data integration, and ethical AI practices. AI is expected to continue revolutionizing predictive analytics, with machine learning algorithms becoming even more sophisticated and capable of handling highly complex, multidimensional data. Techniques such as reinforcement learning, which adapts based on ongoing feedback, offer the potential to enhance predictive models’ responsiveness to real-time data, an especially valuable asset in industries with volatile demand. Natural language processing (NLP) will also play a growing role, as it allows companies to analyze unstructured data sources like social media, reviews, and customer feedback, generating insights into customer sentiment and preferences that enhance demand forecasting accuracy.

    Real-time data integration is another area of tremendous potential. Enabled by IoT devices, 5G connectivity, and cloud infrastructure, real-time data allows companies to monitor customer behavior and market trends continuously, updating forecasts and making adjustments as new information becomes available. This level of responsiveness can be particularly beneficial in retail and e-commerce, where sudden shifts in consumer preferences or competitor actions can significantly impact demand. Real-time analytics offers businesses a competitive edge by providing the agility to adapt quickly, ensuring that their forecasting processes remain relevant and aligned with actual market conditions.

    Alongside technological advancements, there is an increasing emphasis on ethical considerations and data privacy in predictive analytics. As organizations rely on customer data to drive predictive models, adhering to regulatory frameworks such as the General Data Protection Regulation (GDPR) is essential to protect consumer rights and build trust. Privacy-preserving techniques, such as differential privacy and data anonymization, are becoming standard practices, allowing companies to leverage predictive insights while maintaining data security. These methods not only ensure compliance but also support ethical AI practices that prioritize transparency, fairness, and accountability in data-driven decision-making.

    Practical Implications and Recommendations

    To fully realize the potential of predictive analytics in sales forecasting, businesses must approach implementation strategically, addressing technical and ethical considerations from the outset. First, companies should invest in establishing robust data governance policies, focusing on data quality, integration, and standardization. High-quality data is foundational to effective predictive analytics, and organizations that prioritize these practices are better equipped to achieve accurate, reliable forecasts. Additionally, developing cross-functional data-sharing protocols can streamline data flow between departments, ensuring that predictive models draw from comprehensive and diverse datasets.

    In selecting predictive models, companies should consider both accuracy and interpretability, aligning model complexity with their specific forecasting needs. For organizations where transparency is essential, models such as decision trees and linear regression may offer sufficient accuracy while remaining accessible to non-technical stakeholders. In scenarios that demand high precision, advanced machine learning models can be utilized, with explainable AI techniques applied to enhance model transparency and foster stakeholder trust. Regular model evaluation is also recommended to assess accuracy, detect bias, and adjust models in response to changing data patterns or market conditions.

    Furthermore, businesses should incorporate ethical AI practices, actively addressing biases in data and models to ensure fairness. Regular audits of predictive models, along with the use of diverse and representative datasets, can help identify and correct biases, promoting ethical and inclusive forecasting practices. Finally, as regulatory landscapes evolve, companies must stay informed about data privacy requirements, implementing privacy-preserving technologies that safeguard consumer information while maintaining analytical rigor.

    Concluding Thoughts

    The integration of predictive analytics into sales forecasting is shaping a new era of business intelligence, characterized by data-driven strategies that enhance forecasting precision, agility, and ethical accountability. While challenges related to data quality, model interpretability, and algorithmic bias persist, advancements in AI, real-time data integration, and explainable AI are paving the way for more effective, transparent, and

    ethically grounded predictive models. By addressing these challenges and adopting best practices in data governance, interpretability, and privacy, organizations can harness predictive analytics to build resilient, adaptive sales forecasting frameworks.

    As businesses continue to adapt to rapidly changing markets, predictive analytics will remain a vital tool, enabling them to anticipate trends, allocate resources strategically, and make proactive decisions. The future holds tremendous potential for predictive analytics in sales forecasting, offering organizations a pathway to not only meet but shape customer demand, secure competitive advantages, and contribute to a more ethically responsible, data-driven economy.

    André Luiz de Paula Magrini Vice Chairman, Marketing and Communication Committee, American Feed Industry Association (AFIA). Sales Director, AG Growth Intl (AGI) Email: contato@andremagrini.com

    References

    1.Hyndman, R. J., & Athanasopoulos, G. (2018). Forecasting: Principles and Practice (2nd ed.). OTexts.

    2.Goodfellow, I., Bengio, Y., & Courville, A. (2016). Deep Learning. MIT Press.

    3.Chen, H., Chiang, R. H. L., & Storey, V. C. (2020). “Business Intelligence and Analytics: From Big Data to Big Impact.” MIS Quarterly, 36(4), 1165-1188.

    4.Chong, A. Y. L., Li, B., Ngai, E. W. T., & Ch'ng, E. (2017). "Predicting online product sales via online reviews, sentiments, and promotion strategies: A big data architecture and neural network approach." International Journal of Operations & Production Management, 37(3), 447-468.

    5.Marr, B. (2017). Data Strategy: How to Profit from a World of Big Data, Analytics, and the Internet of Things. Kogan Page.

    6.Saghiri, S., Wilding, R., Mena, C., & Bourlakis, M. (2017). "Toward a three-dimensional framework for omni-channel." Supply Chain Management: An International Journal, 22(2), 187-204.

    7.Obermeyer, Z., Powers, B., Vogeli, C., & Mullainathan, S. (2019). "Dissecting racial bias in an algorithm used to manage the health of populations." Science, 366(6464), 447-453.

    8.Rai, A. (2020). "Explainable AI: From black box to glass box." Journal of the Academy of Marketing Science, 48(1), 137-141.

    9.Topol, E. J. (2019). Deep Medicine: How Artificial Intelligence Can Make Healthcare Human Again. Basic Books.

    10.Agrawal, A., Gans, J. S., & Goldfarb, A. (2018). Prediction Machines: The Simple Economics of Artificial Intelligence. Harvard Business Review Press.

    11.Davenport, T. H., & Ronanki, R. (2018). "Artificial Intelligence for the Real World." Harvard Business Review, 96(1), 108-116.

    12.Box, G. E. P., Jenkins, G. M., & Reinsel, G. C. (2015). Time Series Analysis: Forecasting and Control (5th ed.). Wiley.

    13.Makridakis, S., Spiliotis, E., & Assimakopoulos, V. (2018). "Statistical and Machine Learning Forecasting Methods: Concerns and Ways Forward." PLOS ONE, 13(3), e0194889.

    14.Magrini, Andre (2024) Introduction to Sales and Marketing Analytics: Theories and Cases

    15.Lee, H. L., Padmanabhan, V., & Whang, S. (2014). "The Bullwhip Effect in Supply Chains." MIT Sloan Management Review, 38(3), 93-102.